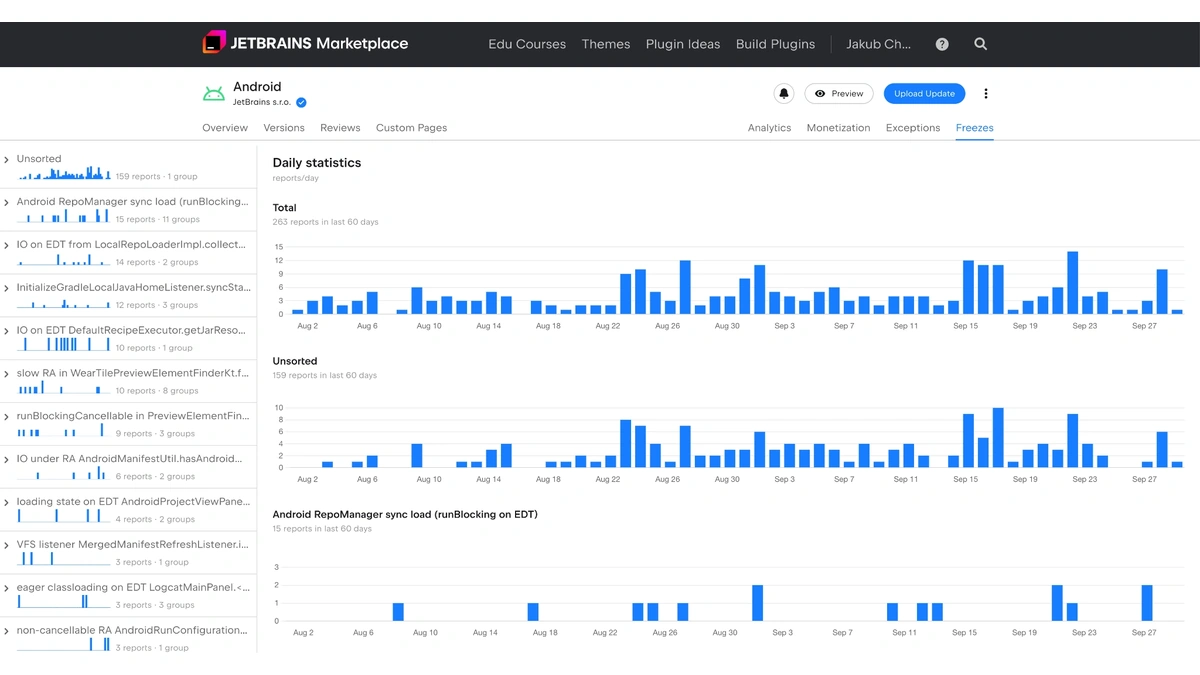
UI freeze reports are now available to plugin authors in JetBrains Marketplace, which means a developer can see the thread dumps captured at the moment an IDE stopped responding. JetBrains says every report attributed to a plugin shows up on a Freezes tab in that plugin's management page, so the "it works on my machine" stalemate has something concrete to chew on.
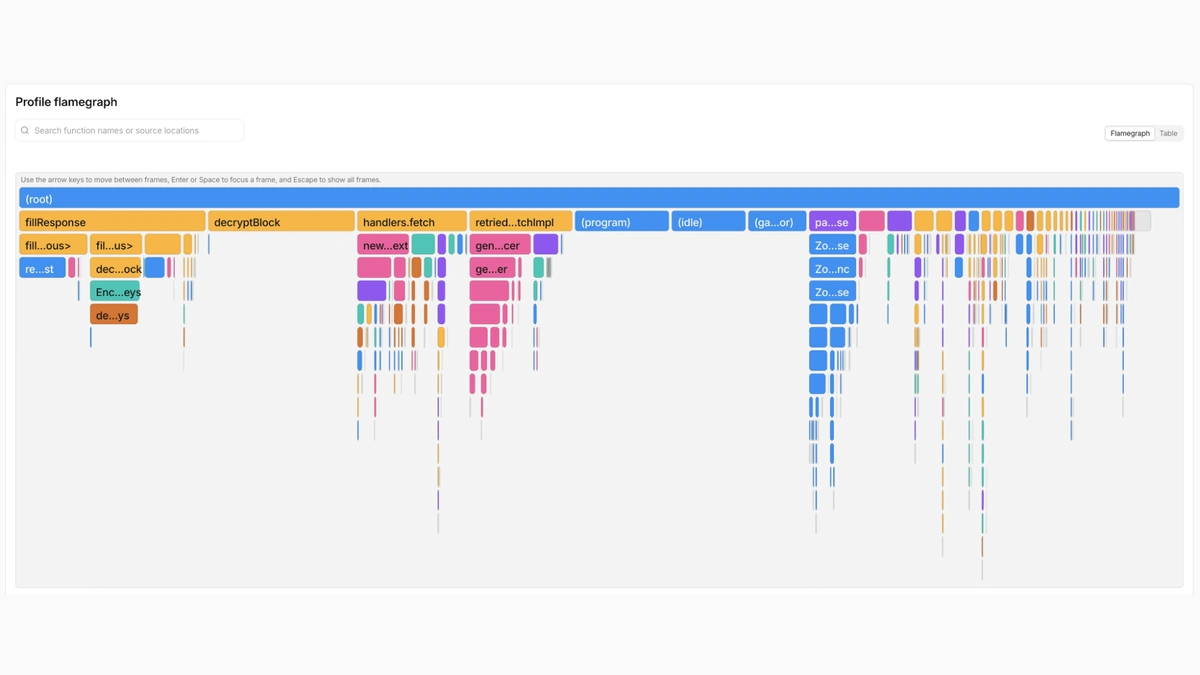
Marketplace sorts UI freeze reports by error type and gathers similar ones into piles, each represented by a single report, so recurring patterns are visible without opening every occurrence. Each report carries an automatically generated excerpt of the threads judged to be involved in the freeze. The full dump-N.txt files hold thread dumps taken every five seconds while the IDE was stuck. Depending on what the IDE managed to capture, a report may also include snapshot.jfr (a CPU snapshot), report.txt (an analysis of the stacks) and open-telemetry-metrics.csv, which covers areas such as virtual file system activity and UI responsiveness.
UI freeze reports only reach plugins that opt in, and the Freezes tab stays empty otherwise. The author has to register the built-in handler in plugin.xml, using the class com.intellij.diagnostic.JetBrainsMarketplaceErrorReportSubmitter, which JetBrains says has existed since IntelliJ Platform 2023.3 and needs no custom code. Plugins that support Split Mode must register it in a frontend or shared module, because a backend-only registration does not reach the frontend. Reports also depend on users: they either submit through the IDE's error-reporting dialog or turn on automatic sending, and the IDE has to identify the plugin as involved in the first place.
To read a UI freeze report, JetBrains points to the event dispatch thread, usually named AWT-EventQueue-0, and asks whether it is doing expensive work itself or waiting on something else. Pasting a full dump into the IDE's Analyze Stack Trace or Thread Dump action helps, and comparing several dumps shows whether the same operation sits on the stack across samples. The example in the post finds file I/O on the dispatch thread inside XMLFilterImpl.parse. Not every culprit sits there, though. A long, non-cancellable read action on a background thread can hold a lock that a write action needs, leaving the UI waiting while the costly work runs elsewhere.
UI freeze reports are also meant to feed coding agents, starting with the excerpt. JetBrains colleague Patrick Scheibe wrote an analyze-freeze skill covering coroutine behavior and Dispatchers.Default starvation, and the short excerpt uses fewer tokens than the full dumps. JetBrains adds two cautions: follow the project's rules for diagnostic data before sending dumps to an AI service, and check any frame the agent cites against the real dump and code. A related caveat concerns versions. Plugin version information is not always attached, and when it is missing the report should be treated as coming from an unknown release, never assumed to match the latest one.