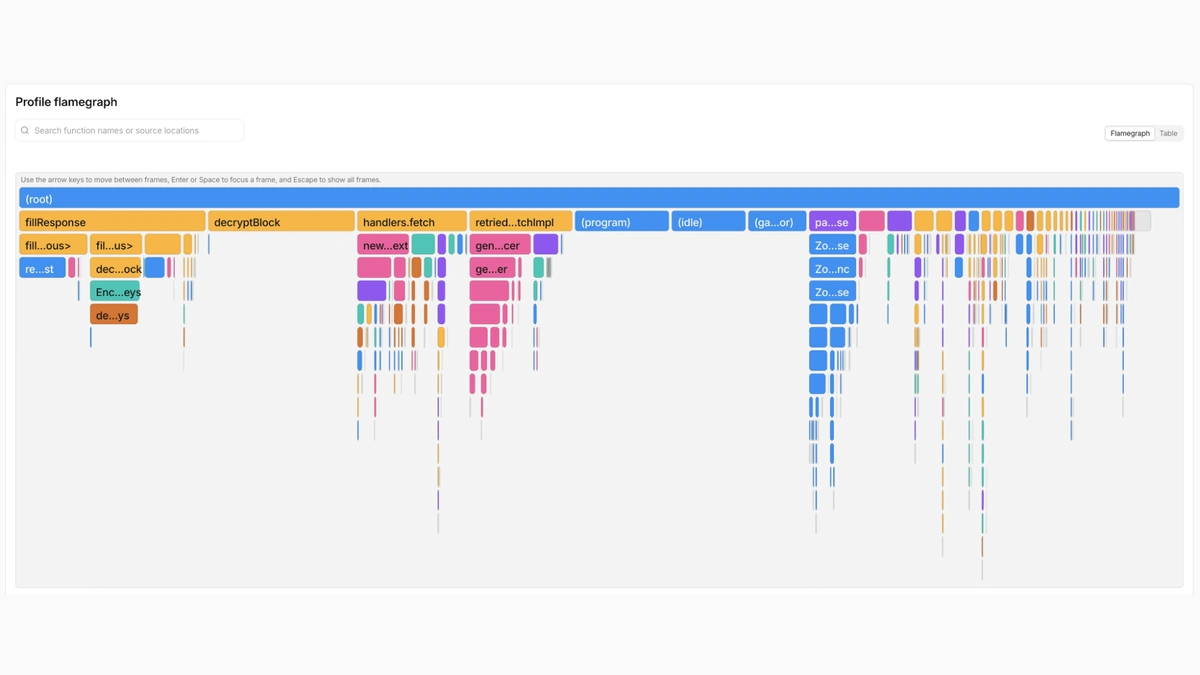
Cloudflare Workers developers can now ask for a CPU or memory profile of a live production Worker and read the result as an interactive flamegraph. Cloudflare extended the same capability to Durable Objects, and it works from the Observability tab of the dashboard or from a command-line call that writes a pprof file.
A profile run needs a deployed version of the Worker and a duration; the CLI example in the post uses 5,000 milliseconds. Each rectangle in the flamegraph is a function call, and its width shows how much CPU time or memory that function accounts for. Cloudflare Workers does not start a fresh isolate for the capture, because the goal is to observe real traffic, so a Worker with little load produces a thin profile. TypeScript projects need source maps enabled, or function names show up obfuscated.
The most useful part of the announcement is the set of fixes Cloudflare's own teams made with it. A 50-second CPU capture of the Worker behind the R2 binding exposed a JSON replacer that kept walking the tree it was already being called on, so nested values were processed repeatedly. Removing the duplicate work made that function 2.7x faster. A second finding was a metrics call made twice, worth about 1% of CPU time on its own. The memory case was starker: an internal Worker had a P999 memory of 133 MB against the 128 MB limit and kept being evicted with "Exceeded Memory" errors. A heap profile showed Prometheus instrumentation, believed to be switched off, accounting for roughly 66.7% of allocations. After the team removed it, P50 fell from 70 MB to 54 MB and P999 from 133 MB to 118 MB.
Profiling in Cloudflare Workers could already be done locally through Chrome DevTools, but a local run never sees the traffic mix of production. For a CPU profile, the runtime starts a V8 sampler at a one-millisecond interval and holds the isolate lock only to start and stop it, so requests keep running during the capture. Durable Objects can be profiled by name, with the request routed to the machine that owns that object.
The limits are specific. A session has to be started by hand, so a brief misbehavior can pass before anyone captures it, and the memory profiler only sees allocations made inside the profiling window, which hides heavy start-up allocation. Cloudflare says it is already working on continuous profiling that would sample Workers automatically, but it gives no date. Until then, the tool suits a problem a developer can reproduce under load more than one that appears once overnight.