Sentry is an error tracking platform that captures runtime exceptions, stack traces, and release-level regression data directly from application code.
Datadog and New Relic compete in the same observability space with broader signal coverage: infrastructure metrics, APM traces, logs, and synthetic checks. Teams that conflate these tools end up paying for capabilities they won't use, or shipping without the error attribution workflow they actually need. The signal type each tool produces determines which failure mode it solves, and that distinction is the right axis for selection.
Three Tools, Three Observability Problems
Datadog, New Relic, and Sentry address overlapping but distinct failure modes: infrastructure and APM breadth, unified full-stack telemetry, and developer-facing error tracking respectively. Understanding the signal each tool was designed to surface is the starting point for any rational selection decision. Telemetry data from a distributed system takes many forms: host-level metrics, request traces, log lines, and application exceptions. Each tool has a native home on that spectrum.
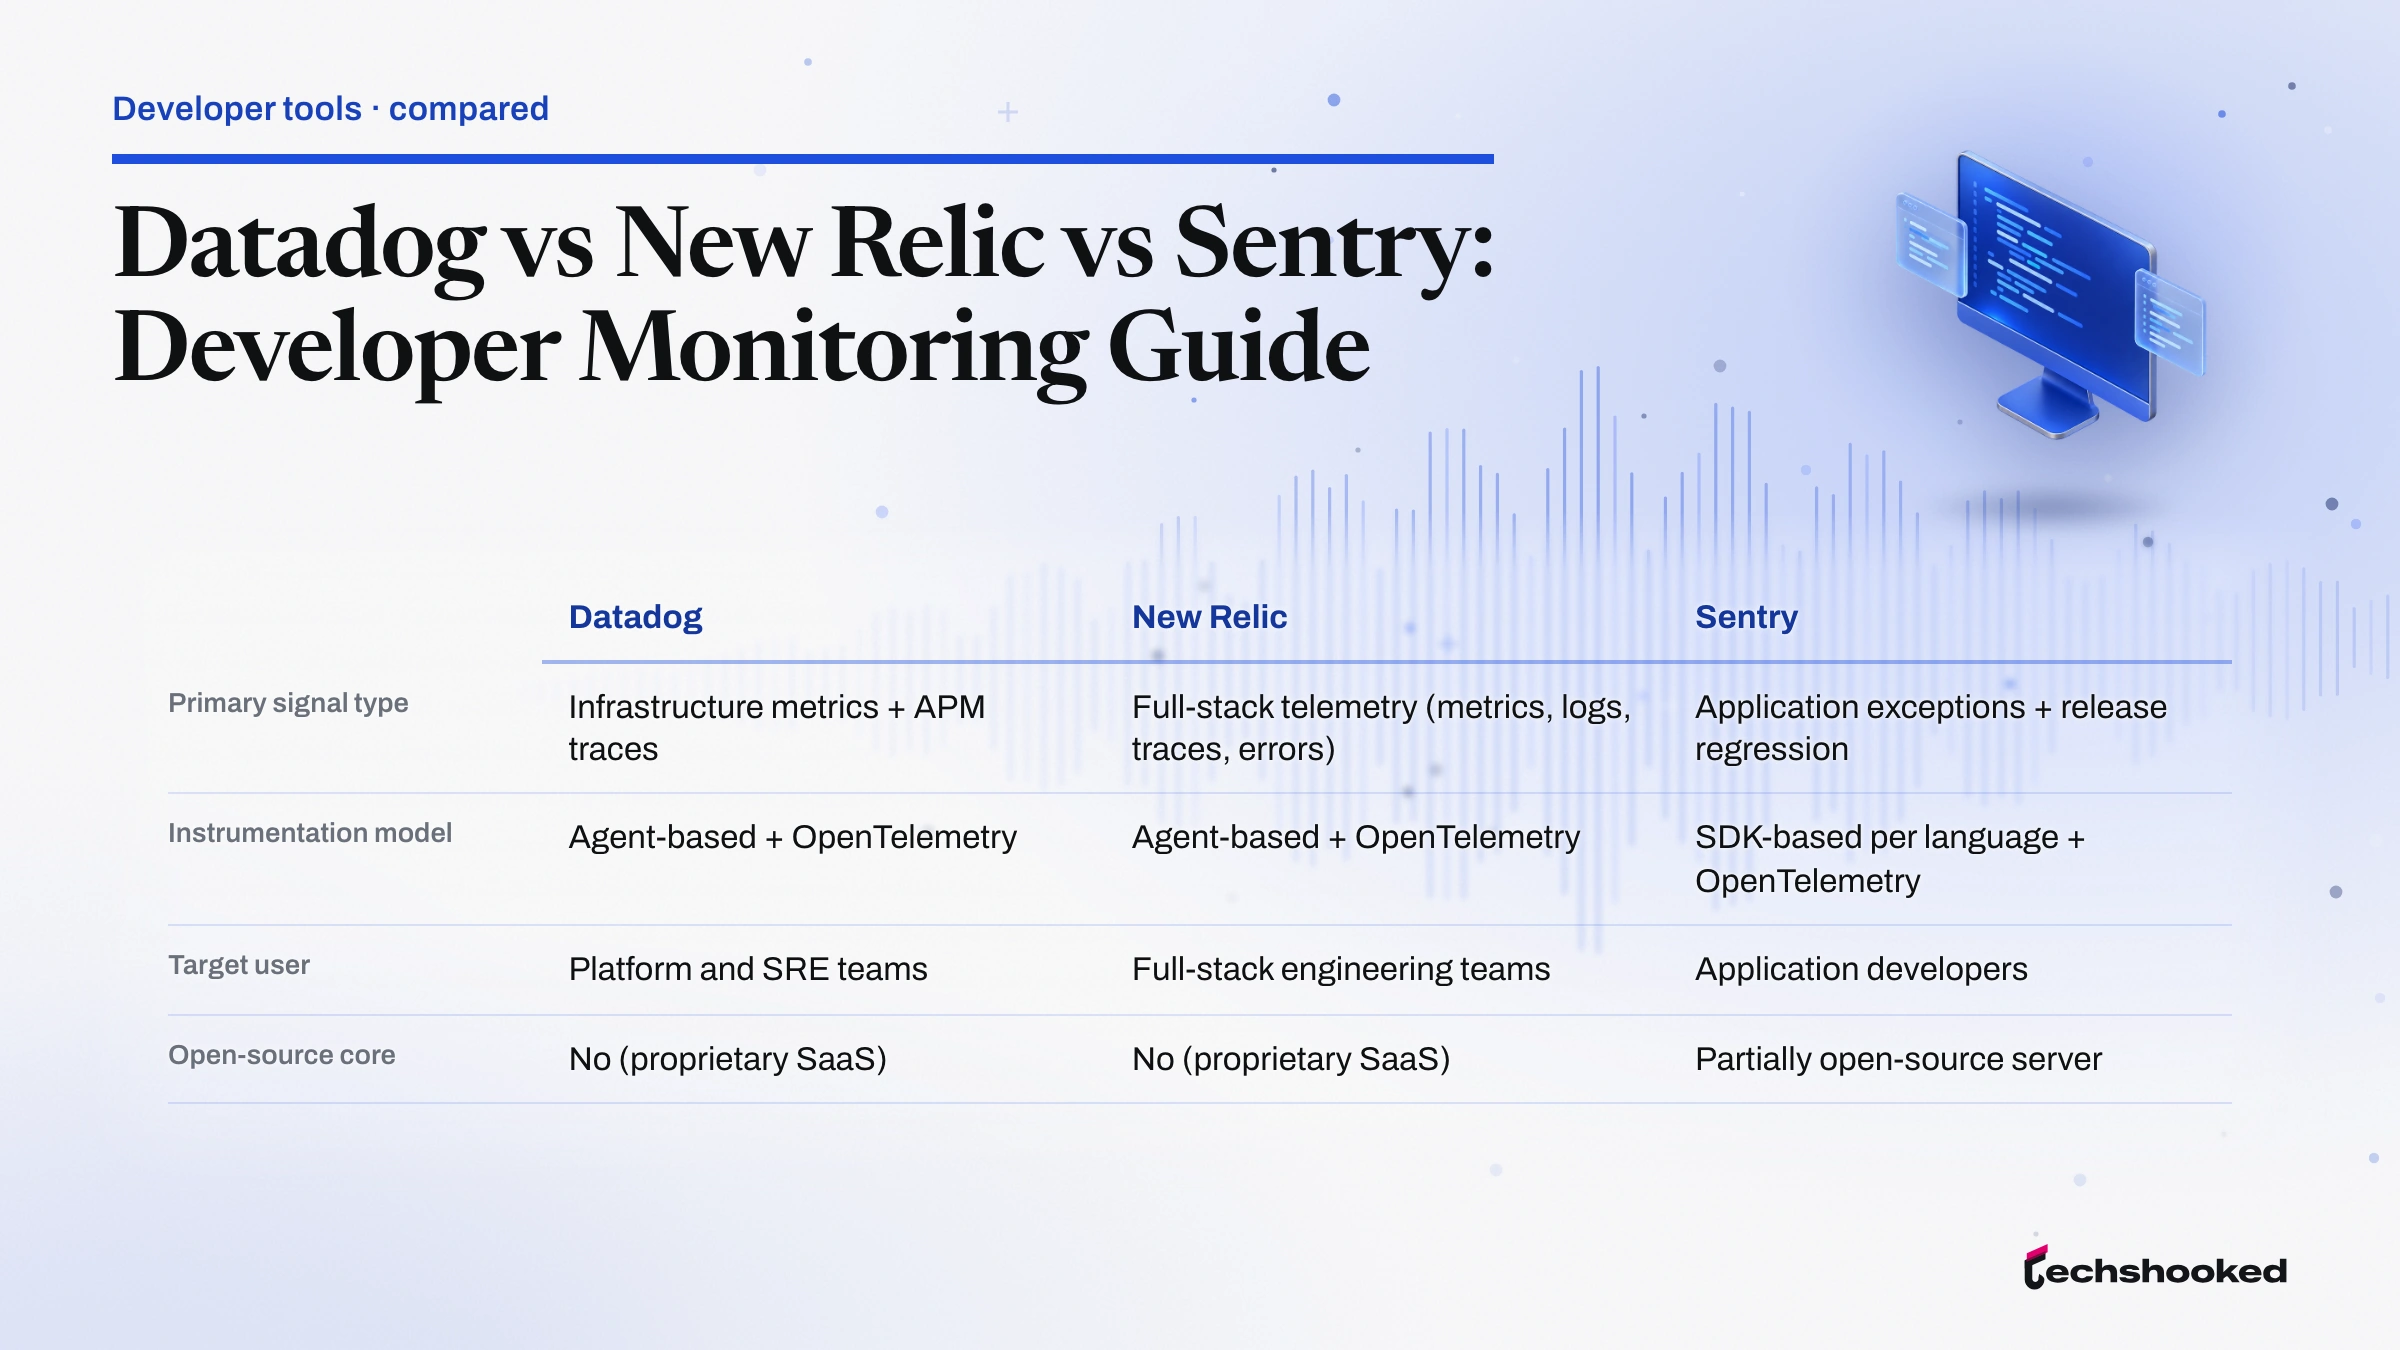
| Attribute | Datadog | New Relic | Sentry |
|---|---|---|---|
| Primary signal type | Infrastructure metrics + APM traces | Full-stack telemetry (metrics, logs, traces, errors) | Application exceptions + release regression |
| Instrumentation model | Agent-based + OpenTelemetry | Agent-based + OpenTelemetry | SDK-based per language + OpenTelemetry |
| Target user | Platform and SRE teams | Full-stack engineering teams | Application developers |
| Open-source core | No (proprietary SaaS) | No (proprietary SaaS) | Partially open-source server |
| Free tier available | Limited trial access | One full platform user + 100 GB ingest/month | Developer-tier plan for small event volumes |
Free tier details change with vendor pricing cycles. Verify current terms at each vendor's pricing page before procurement.
Datadog: Infrastructure and APM Breadth
Datadog is an observability platform that aggregates metrics, logs, distributed tracing, and infrastructure monitoring signals into a unified SaaS dashboard. Teams running workloads across AWS, Azure, and GCP use Datadog because a single agent deployment captures host-level metrics, container stats, network flows, and application performance monitoring (APM) traces without requiring separate tooling per signal type. For teams comparing Datadog against AWS-native tooling, Amazon CloudWatch provides a useful baseline for understanding what cloud-native infrastructure monitoring covers before evaluating a third-party SaaS layer. Datadog accepts telemetry data via its own agent, via direct API, and via OpenTelemetry-native pipelines. The platform's APM tracing product, documented at docs.datadoghq.com/tracing/, includes service maps that visualize upstream and downstream dependencies from trace data. Verify current pricing tiers at the Datadog pricing page before procurement decisions, as tier structures change independently of feature updates.
- Infrastructure metrics: Agent-based collection of CPU, memory, disk, and network metrics from hosts, Kubernetes nodes, and cloud services, with out-of-the-box dashboards for major cloud providers.
- APM with service maps: Distributed tracing across microservices, auto-generated service dependency graphs, and flame-graph profiling to identify latency at the function level.
- Log management: Centralized log ingestion, parsing, and search with log-to-trace correlation. NIST SP 800-92, the Guide to Computer Security Log Management, addresses log retention and aggregation as a security practice; enterprise teams frequently cite its guidance when establishing log management policies for compliance audits. Structured log formats conforming to IETF RFC 5424 (the Syslog protocol) parse cleanly into Datadog's log pipeline.
- Synthetic monitoring: Browser and API tests that simulate user paths on a schedule, catching regressions in uptime or response time before users report them.
New Relic: Full-Stack Telemetry on a Consumption Model
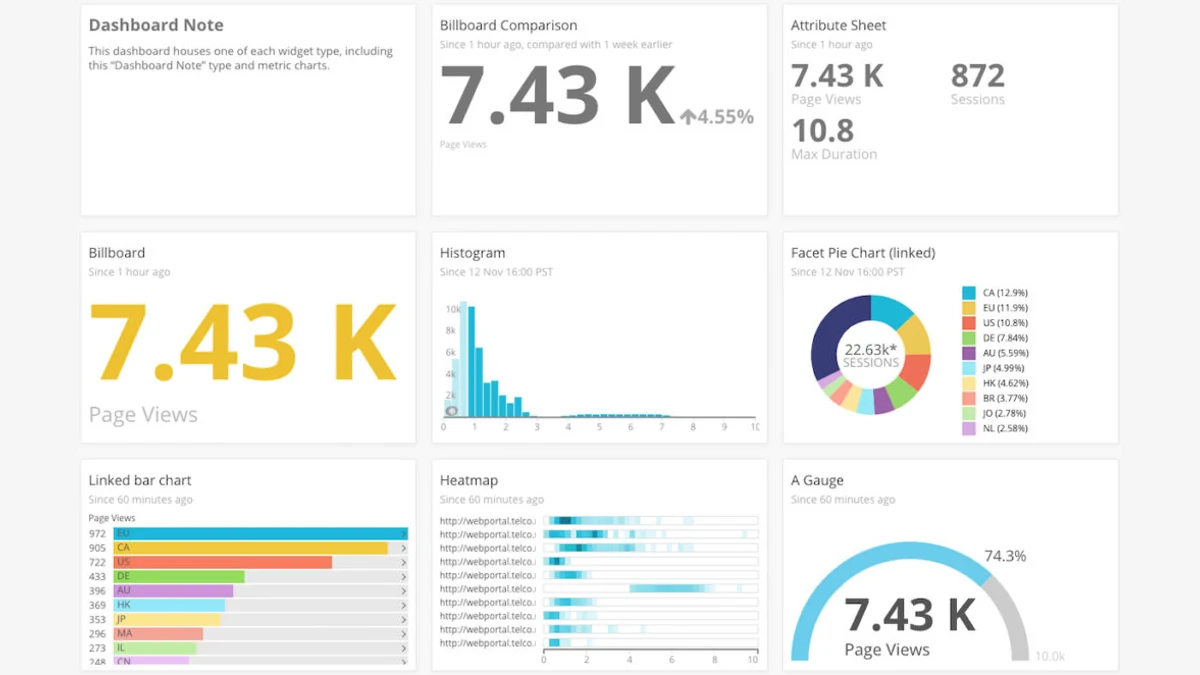
New Relic is a full-stack observability platform that ingests metrics, logs, distributed tracing, and error data under a single consumption-based pricing model rather than per-product subscriptions. Where Datadog charges per host or per product module, the platform bills primarily on data ingest volume and seat count, which can reduce costs for teams with variable workloads or broad but shallow coverage needs. New Relic's free tier includes one full platform user and 100 GB of data ingest per month, covering application performance monitoring (APM) with distributed tracing, error tracking, log management, and infrastructure monitoring, as documented at newrelic.com/pricing. The platform also offers core users access to telemetry data in their IDE via the CodeStream extension (newrelic.com/pricing). New Relic supports OpenTelemetry natively, so teams can instrument once via the OpenTelemetry SDK and route telemetry data to the vendor without adopting vendor-specific agents. For the current full list of supported APM language agents, see the New Relic APM introduction at docs.newrelic.com. Verify current consumption rates at the vendor's pricing page before procurement.
- APM: Distributed transaction tracing, throughput and error-rate dashboards, and service-level objective tracking; New Relic accepts both its own language agents and OpenTelemetry-instrumented services in the same trace graph.
- Distributed tracing: Waterfall trace views with cross-service span correlation, with support for W3C Trace Context propagation alongside native vendor trace headers.
- Log management: Unified log ingest with log-in-context linking: traces and errors connect directly to originating log lines, including structured syslog-compatible data.
- Browser and mobile monitoring: JavaScript error capture, Core Web Vitals reporting, and crash reporting for mobile platforms, giving teams front-end visibility alongside back-end APM data in a single interface.
Sentry: Error Tracking and Release Regression
Sentry is an error tracking platform that captures exceptions, stack traces, and breadcrumbs at the application layer and maps them to specific releases, commits, and code owners. Unlike APM tools that surface service-level metrics, Sentry's primary output is an actionable error report: the exact line of code that threw, the user context at the time, the breadcrumb trail of prior events, and the release that first introduced the failure. Sentry's capability set, including Error Monitoring, Tracing, Session Replay, and Logs, is documented at docs.sentry.io. Sentry's server is partially open-source, with a self-hosted deployment option for teams that cannot send exception data to a third-party SaaS; verify current self-hosted availability and configuration at the Sentry developer documentation. Alert fatigue is a common complaint with broad APM platforms; Sentry reduces noise by grouping identical exceptions into single issues and surfacing only new or regressed errors rather than re-alerting on known stable failures.
- Exception capture with stack trace: SDK-level interception of unhandled and handled exceptions across server and client runtimes, with full stack trace and local variable capture at the point of failure, as documented at docs.sentry.io.
- Release regression detection: Automatic comparison of error rates across deployments, flagging regressions introduced by specific releases and linking each error to the commit SHA and deploy timestamp.
- Source map processing for JavaScript: Upload of source maps at deploy time lets Sentry de-minify production stack traces back to original TypeScript or ES module source, making front-end error triage practical without a local dev environment.
- Issue ownership routing: Routes new errors to the team or individual responsible for the affected file path using code-owner configuration, reducing alert fatigue by directing noise to the right person. Sentry also applies spike protection: when event volume exceeds quota thresholds, events are dropped at the threshold and the SDK receives an HTTP 429 response with a
Retry-Afterheader, as documented at docs.sentry.io/pricing/quotas/manage-event-stream-guide/.
Feature Comparison: Signal Type, Integration, and Workflow Fit
Datadog and New Relic compete on observability breadth, while Sentry occupies a different position as a developer-workflow tool oriented around error tracking and release regression rather than infrastructure health. The table below maps each tool against the signal types most relevant to platform and application engineering teams. Alert fatigue compounds when teams receive infrastructure-level noise from APM tools for problems that are actually code-layer exceptions; using Sentry for application-layer triage alongside an APM tool for infrastructure separates those concerns cleanly. Log management in all three platforms benefits from structured formats: NIST SP 800-92 (Guide to Computer Security Log Management) addresses retention and aggregation as a security discipline, while IETF RFC 5424 defines the Syslog structured format that all three platforms ingest.
| Signal / Feature | Datadog | New Relic | Sentry |
|---|---|---|---|
| Infrastructure metrics | Yes (agent + cloud integrations) | Yes (agent + cloud integrations) | No |
| APM traces | Yes (native + OpenTelemetry) | Yes (native + OpenTelemetry) | Tracing via SDK (error-path focus) |
| Log management | Yes (agent + forwarder) | Yes (agent + forwarder) | Logs (application-layer; in preview) |
| Error tracking | Yes (APM error events) | Yes (APM error events) | Yes (primary signal; issue grouping + ownership) |
| Release regression | Limited (deployment markers) | Limited (deployment markers) | Yes (native; per-commit attribution) |
| Source map support | Partial (RUM) | Partial (browser agent) | Yes (full server-side processing) |
| OpenTelemetry native | Yes (OTLP receiver in agent) | Yes (OTLP ingest) | Yes (SDK + OTLP) |
Choosing the Right Tool for Your Stack
Sentry is the right starting point for teams whose primary pain is uncaught exceptions and release-level regression, not infrastructure capacity or distributed service latency. The four decision scenarios below map team context to tool fit. Teams monitoring IaC-provisioned infrastructure alongside application code will find the infrastructure provisioning tool comparison useful for understanding what sits beneath the monitoring layer. Teams using Sentry alongside CI pipelines that run JavaScript testing frameworks like Jest and Cypress benefit from Sentry's release tagging, which ties test-passing releases to production error rates. API-first teams using Datadog APM or New Relic distributed tracing to monitor REST endpoints will find that consistent RESTful API documentation practices reduce the gap between what a trace shows and what the endpoint contract specifies.
- Developer-first error triage
- Use Sentry. Teams shipping frequent releases that need per-commit error attribution, code-owner-based routing, and source map-resolved front-end stack traces get faster time-to-fix with Sentry than with a general APM platform's error tab.
- Multi-cloud infrastructure at scale
- Use Datadog. Organizations running mixed cloud workloads, Kubernetes clusters, and network-level infrastructure monitoring need Datadog's infrastructure monitoring depth and its breadth of cloud-provider integrations.
- Unified full-stack observability with cost predictability
- Use New Relic. Teams that want APM, distributed tracing, log management, and browser monitoring under one billing model without per-product subscription costs suit New Relic's consumption pricing structure, provided ingest volume stays within forecast. The free tier details are at newrelic.com/pricing.
- Combined APM plus error tracking
- Run Datadog or New Relic alongside Sentry. Production teams at scale commonly run an APM platform for infrastructure health and service-level monitoring while routing application exceptions to Sentry for developer-facing triage. Sentry integrates with common incident and project management tools; verify current integrations at sentry.io/integrations/ before committing to a workflow.
Teams combining tools should establish clear ownership boundaries early: which tool owns the alert, which owns the runbook link, and which owns the post-incident release regression check. Without that governance, full-stack observability becomes full-stack alert fatigue.
Further reading
Frequently Asked Questions
Can Sentry replace Datadog for production monitoring?
Sentry does not replace Datadog for infrastructure or APM monitoring. Sentry captures application-layer exceptions, stack traces, and release regressions, but it does not collect host metrics, network throughput, or distributed service latency in the way Datadog does. Teams monitoring production systems at scale typically run Sentry alongside Datadog or New Relic: Sentry handles code-level error triage while the APM tool handles infrastructure health and service performance.
Does Datadog support OpenTelemetry instrumentation?
Yes. Datadog accepts OpenTelemetry traces, metrics, and logs via the OpenTelemetry Collector with the Datadog exporter, and its agent includes a native OTLP receiver. Teams can instrument applications once using the OpenTelemetry SDK and route telemetry data to Datadog without vendor-specific libraries. Verify the current OTLP feature matrix at the Datadog OpenTelemetry documentation page, as support scope changes across agent versions.
Which tool is best for tracking JavaScript front-end errors?
Sentry is the strongest fit for JavaScript front-end error tracking, with source map processing that de-minifies production stack traces back to original source files. Its release integration tags every error to the deployment commit that introduced it. Datadog and New Relic offer browser monitoring with JavaScript error capture, but their error-to-release regression workflow is less precise than Sentry's code-owner and commit-level attribution model.
Are there free tiers for Datadog, New Relic, and Sentry?
All three tools offer entry-level access at no cost, but the scope and limits differ and change with vendor pricing updates. Check the current free tier terms directly on each vendor's pricing page before making a team procurement decision, as these figures are not stable enough to reproduce accurately here. In general, Sentry offers a developer-tier plan for small event volumes, while Datadog and New Relic offer trial periods and limited free tiers for infrastructure and APM.
Can Datadog, New Relic, and Sentry be used together?
Yes, and combining them is a common production pattern. Teams often run Datadog or New Relic for infrastructure metrics, APM, and distributed tracing across services, while routing application exception data to Sentry for developer-workflow error triage. Sentry supports alert webhooks and integrates with common incident and project management tools; verify current integrations at the Sentry integrations page before committing to a workflow.