A game testing tool is a software utility that validates gameplay correctness, measures performance, and surfaces defects before a title ships to players. Studios of every size treat game quality assurance (game QA) as a mandatory gate between a feature-complete build and a public release. The cost of a shipped defect in a commercial game routinely exceeds the cost of the full QA cycle that would have caught it, which makes the choice of tooling a direct business decision, not an afterthought.
What Game Testing Tools Do
A game testing tool provides the instrumentation a studio needs to detect defects, measure frame performance, and validate save-state integrity across build cycles. The field covers four distinct categories, each targeting a different failure surface in the game quality assurance pipeline. Defect severity varies sharply by category: a collision detection failure that pushes the player through geometry scores higher than a misaligned UI element, and each tool category addresses a different layer of that risk stack. Understanding which build pipeline stage each tool occupies is the first step toward selecting the right combination.
- Functional test runners
- Execute scripted test cases against game logic: save serialization, inventory transactions, collision detection responses, and win/lose conditions. Unity Test Runner (NUnit-based, engine-native) is the canonical example in this category.
- Performance profilers
- Sample frame rate (FPS), memory allocation, draw calls, and CPU thread utilization during live play sessions to identify bottlenecks before a build exits internal QA.
- Test case management systems
- Organize, assign, and track manual test cases across sprints. TestRail is the most widely adopted test case management (TCM) system in commercial game studios.
- Exploratory session trackers
- Log tester activity, timestamps, and defect notes during unscripted play sessions where the tester probes for unexpected behavior rather than following a defined script.
Manual QA Techniques and Tooling
Game testing tools in the manual category rely on structured test case management software, exploratory session logs, and bug-tracking systems to capture defects that automated scripts cannot surface. Manual game testing remains the primary method for evaluating feel, pacing, and AI behavior, because those qualities require human judgment to assess. A solo developer shipping a first title typically runs manual game testing exclusively before moving toward automation on a second project once the codebase stabilizes.
TestRail provides a TCM layer that converts a tester's checklist into a versioned, assignable record with pass/fail status and defect links. JIRA integrates as the defect-tracking backend: each failing test case generates a JIRA issue with defect severity, reproduction steps, and build reference. Exploratory testing sessions are logged with time-boxed charters that define the area under investigation without prescribing every step, giving testers the flexibility to follow unexpected behavior rather than stop at the edge of a script.
A structured QA workflow for manual sessions typically follows this sequence:
- Define a test charter for each exploratory session, scoping the feature area and the risk hypothesis to investigate.
- Log each observed anomaly with a build hash, platform, reproduction rate, and an initial defect severity rating.
- Triage defects by severity in a daily standup and assign blocking issues to the build queue before the next integration branch.
- Track test case pass rates per build in TestRail to identify which features regress most frequently across sprints.
- Close each exploratory session with a written summary of areas not covered, so subsequent sessions extend coverage rather than repeat it.
For developers selecting their first engine before setting up a QA process, Best Game Development Engine for Beginners covers how engine choice shapes the testing surface a team will need to manage.
Automated Game Testing Approaches
Automated game testing tools execute deterministic regression scenarios without human input, covering collision detection, save serialization, and UI navigation paths at a speed no manual session can match. The economic case for automated game testing rests on repeatability: once a regression test suite passes against a stable build, any subsequent build that breaks the same behavior is flagged within minutes of the CI trigger rather than days into a manual test cycle.
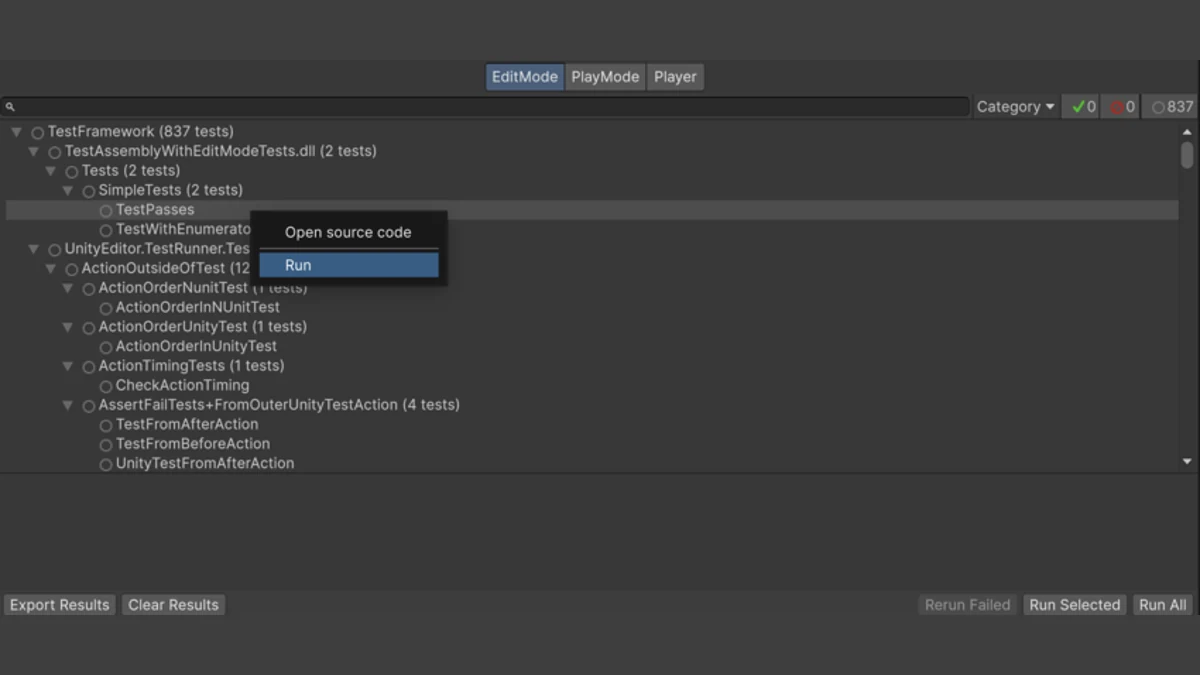
Unity Test Runner is the engine-native automated game testing framework for Unity projects. It uses NUnit as its underlying assertion library and exposes two test modes: Edit Mode for pure C# logic tests that run outside the player loop, and Play Mode for integration tests that execute inside a running scene. Both modes plug into a build pipeline through Unity's CI integration layer, which lets teams gate a build on test-suite pass status before promoting it to the staging branch. For engine-specific documentation on the Test Framework package, the Unity Test Runner documentation at docs.unity3d.com covers the current package API.
Beyond Unity, general CI-integrated scripted testing approaches use bot agents that navigate the game world following pre-recorded input sequences, checking that environment geometry, trigger zones, and state transitions behave identically across builds. These bots are particularly effective for regression testing open-world traversal paths and loading screen transitions, which are high-frequency regression targets after physics engine updates.
Common use cases for automated game testing in a build pipeline:
- Save-state serialization and deserialization across all supported platforms, confirming that data written on one platform loads correctly on another.
- Collision detection boundary verification on static geometry after each physics layer update.
- UI navigation path testing across all primary menus and settings screens.
- Audio event trigger validation to confirm that sound cues fire on the correct game state transitions.
- Localization string truncation checks across all supported locales to catch text overflow before a platform submission.
Developers coming from a web or browser game background will find that the scripting patterns used for game automation share structure with general test frameworks. Getting Started with Game Development Programming Languages covers the language choices that shape which automation APIs are available to a team.
Performance Profiling Tools
Game testing tools focused on performance profiling measure frame rate, memory allocation, draw calls, and CPU thread utilization to pinpoint bottlenecks before a build exits internal QA. Performance problems that survive into a released build are disproportionately expensive: frame rate drops that cross a perceivable threshold generate negative reviews within hours of launch, and the patch cycle needed to address them disrupts every other QA workflow already in progress.
GameBench targets mobile frame rate profiling, capturing FPS data, jank metrics, and battery temperature from Android game sessions over a standard USB or Wi-Fi connection (Google Play Store). It does not require the game's source code, which makes it practical for studios profiling third-party builds or testing competitor titles for benchmark calibration. Engine-native profilers cover the deeper layer: Unity Profiler exposes per-frame CPU and GPU timelines at the method call level, while Unreal Insights captures trace data across the Unreal Engine rendering and game thread simultaneously. Both categories are covered in the academic literature on game performance analysis, including the IEEE Software paper on testing computer games (ieeexplore.ieee.org).
A standard performance profiling session follows these steps:
- Baseline capture: Record a profiling session on the known-good build to establish target frame rate and memory ceiling values for the current platform.
- Regression candidate run: Run the same session on the candidate build and record the delta in FPS, draw calls, and peak memory against the baseline.
- Hotspot identification: Open the engine profiler timeline and locate the CPU or GPU method consuming the largest percentage of frame budget above the baseline.
- Root cause isolation: Narrow the hotspot to a specific asset, shader, or script call by disabling sub-systems incrementally until frame time returns to baseline.
- Verification pass: Re-run the full profiling session after the fix is applied to confirm the regression is resolved without introducing new overhead elsewhere in the build pipeline.
Comparing Top Game Testing Tools
Game testing tools differ most sharply on engine integration depth, scripting API surface, and platform coverage, and a side-by-side view makes those trade-offs concrete. The ACM SIGSOFT paper on foundations of game software engineering (dl.acm.org) notes that tool selection in game QA is largely determined by the integration surface a studio can maintain, making engine-native tools the default starting point for small teams. The comparison below covers the four tools most commonly cited in small-studio QA workflows: Unity Test Runner, GameBench, TestRail, and JIRA.
| Attribute | Unity Test Runner | GameBench | TestRail | JIRA |
|---|---|---|---|---|
| Category | Automated game testing (functional) | Performance profiling | Test case management (TCM) | Defect tracking / QA workflow |
| Engine integration | Native (Unity only) | Device-level, engine-agnostic | Engine-agnostic | Engine-agnostic |
| Platform support | All Unity-supported platforms | Android, iOS | All platforms (manual records) | All platforms (issue records) |
| Scripting language | C# (NUnit API) | No scripting; GUI + API export | No scripting; REST API available | Groovy / REST API for automation |
| License model | Open; included with Unity license | Commercial subscription | Commercial subscription | Commercial subscription (free tier available) |
Choosing the Right QA Methodology for Your Project
Choosing a game testing tool for a specific project requires mapping the team's build cadence, project scope, and defect-risk profile to the tool category that covers those risks most efficiently. For solo indie developers and small studios, the decision surface is narrower than for large teams but the margin for error is smaller: a missed regression on a two-person project with no dedicated QA engineer can delay a launch by weeks. The unique-attribute differentiator for this spoke is precisely that angle: the QA toolchain decision for a small team is driven by cost and maintenance overhead in a way that enterprise-oriented comparisons rarely address.
Automated game testing pays off when the same deterministic interaction will be tested more than roughly twenty times across the build cycle. Manual game testing remains the practical baseline when a project's architecture changes structurally every sprint, because maintaining a regression test suite against a shifting codebase costs more than the regressions it catches. Exploratory testing is the default session format for subjective quality dimensions: feel, pacing, difficulty curve, and AI behavior. Mapping which QA workflow tier covers which risk area is the structural decision that precedes any tool selection.
A decision flow for indie and small-studio projects:
- Assess build frequency: If the team ships a new build more than once per week, a regression testing gate on the build pipeline becomes economically viable. Below that cadence, manual QA workflow is the lower-overhead baseline.
- Identify deterministic vs. subjective test targets: List the game systems that produce the same output given the same input (save serialization, collision detection responses, score calculation). These are candidates for automated game testing. Systems requiring judgment (AI behavior, level flow) go to exploratory testing.
- Match tool category to risk area: Assign Unity Test Runner or equivalent to the deterministic list; assign TestRail-managed manual sessions to the subjective list; assign GameBench profiling sessions to any build that targets a new device tier or makes significant rendering changes.
- Set a defect severity taxonomy: Define severity levels before QA begins, not after the first defect is logged. A shared taxonomy prevents triage disagreements from blocking builds on low-impact issues while high-impact ones wait.
- Establish regression gate criteria: Decide the minimum pass rate required for a build to advance to the next stage. A common small-team threshold is 100% pass on P1 (blocking) automated tests and 90% pass on P2 manual test cases before any build enters public testing.
Developers building browser or web-based games who are evaluating JavaScript-based testing frameworks alongside game QA tools will find relevant context at Testing Frameworks Compared: Jest vs Mocha vs Cypress, which covers the test runner decision for web-native environments.
Further reading
- ACM SIGSOFT: Foundations of Game Software Engineering: peer-reviewed treatment of tool integration and QA architecture in commercial game projects.
- IEEE Software: Testing Computer Games: academic framework for defect classification and performance analysis in interactive software.
- GitHub Blog: 6 Strategic Ways to Level Up Your CI/CD Pipeline: practitioner guide to CI-integrated build gating and test automation across studio sizes.
- Streaming Thumbnail Design: How to Create Thumbnails That Drive Clicks
- Top Portable Gaming Consoles: Specs, Battery Life, and Game Libraries Compared
- Twitch vs YouTube: Choosing the Right Live Streaming Platform for Gamers
Frequently Asked Questions
How does game testing differ from software testing?
Game testing covers gameplay correctness, frame-rate consistency, physics behavior, and player experience in ways general software testing tools were not built for. Standard unit testing catches logic errors but cannot assess whether a collision response feels fair or a framerate drop crosses a perceivable threshold. Game QA combines functional test cases, performance profiling sessions, and exploratory play sessions to cover all three dimensions.
How do you choose the right game testing methodology?
Start with the project size and release schedule. Automated regression suites pay off on projects with weekly builds and a dedicated QA engineer; manual exploratory testing is the practical baseline for solo developers shipping a first title. Map your highest-risk areas first, assigning automated checks to deterministic systems like save-state serialization and collision detection, and reserving manual sessions for AI behavior, level flow, and anything requiring subjective judgment about feel.
When should a solo indie developer use manual testing instead of automated game testing?
Manual testing is the right default when a project has fewer than three deterministic systems to regression-test repeatedly. This applies when the codebase changes structurally every sprint, or when the developer's time cost of maintaining a test suite exceeds the time saved by catching regressions automatically. Automated game testing breaks even on small projects only when the same interaction is tested more than roughly twenty times across the build cycle; below that threshold, structured manual test sessions documented in a shared spreadsheet deliver better coverage per hour.