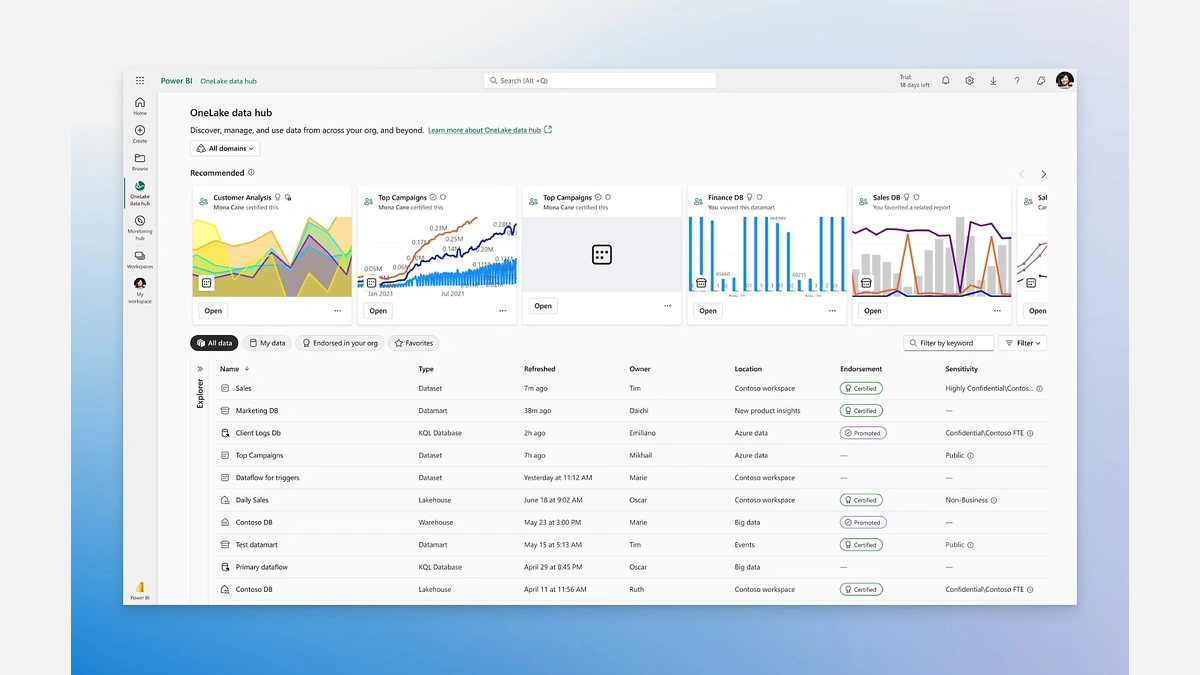
A BI platform is an enterprise software layer that connects to structured data sources, transforms raw records into queryable datasets, and surfaces interactive dashboards and reports that non-technical stakeholders can act on without writing queries. For a mid-market team weighing Tableau, Power BI, and Looker, the practical question is not which business intelligence platform wins a feature checklist; it is which one fits the data stack the team already runs, the skills the team already has, and the licensing budget the CFO has already approved.
This comparison takes a buyer's view of departments with 10 to 200 active users, an existing cloud data warehouse, and no dedicated data engineering org. The three platforms differ less on what they can render and more on how they store data, where they enforce metric definitions, and what they charge to share a dashboard outside the authoring user.
What a BI Platform Actually Does
A BI platform performs three jobs at minimum: it opens a connection to a system of record, it models or transforms the underlying records into business-friendly fields, and it renders interactive data visualization on top of that model. Tableau, Power BI, and Looker all do these jobs. They diverge sharply on the second one, which is where most procurement decisions are actually settled.
The architectural choice that governs the rest of the stack is whether the tool copies data into its own store or passes every query through to the source warehouse. The first pattern, extract-and-load, powers Power BI Desktop import mode and Tableau Extract. The second pattern, live query, powers Looker, Power BI DirectQuery, and Tableau Live Connection. The choice cascades into freshness guarantees, warehouse compute bills, and data governance scope.
Extract Mode vs Live Query: The Core Architectural Choice
- Extract mode: dashboards render fast because the data lives inside the BI layer. Tradeoffs include stale data between refresh cycles, duplicated storage outside the warehouse, and extract refresh jobs that fail silently when source schemas drift.
- Live query mode: dashboards always reflect the current warehouse state. Tradeoffs include warehouse compute pressure on every dashboard load, slower render times for complex aggregations, and a real-time refresh pattern that mirrors operational reporting needs covered in the piece on Realtime Analytics In CRM and Sales Platforms.
- Hybrid: Power BI composite models and Tableau hybrid extracts blend both patterns at the cost of additional modeling complexity, which compounds the architectural limitations cataloged in Common Challenges With Traditional Analytics.
Tableau: Architecture, Strengths, and Licensing

Tableau is a BI platform that pairs a thick-client authoring application with a centralized publishing server, then layers a proprietary visualization grammar called VizQL on top. The authoring tier is Tableau Desktop, the publishing tier is Tableau Server for on-prem deployments or Tableau Cloud for the Salesforce-hosted SaaS edition, and Tableau Prep handles upstream data shaping. The Desktop-first model gives analysts precise control but limits real-time co-authoring compared to browser-native tools.
Tableau's data visualization depth remains the market reference. The VizQL engine handles dual-axis charts, geographic projections, and parameter-driven interactions without the analyst dropping into a scripting layer. A calculated field can express table calculations, level-of-detail expressions, and window functions in a syntax closer to a spreadsheet formula than to SQL, which is why Tableau wins most procurement bake-offs scored on chart expressiveness.
Licensing splits into three role tiers: Creator for authors, Explorer for intermediate self-service users, and Viewer for read-only consumers. Tableau Cloud removes the infrastructure overhead of running Tableau Server but raises the per-Creator price. Row-level security is supported through user filters and entitlement tables, configured per data source rather than centrally, which adds maintenance burden as the number of published workbooks grows. Pricing and connection mechanics are documented in the Tableau documentation.
Where Tableau Leads: Visual Expressiveness and Analyst Control
- VizQL rendering engine produces dense, layered charts without custom code.
- Dual-axis synchronization, parameter controls, and level-of-detail expressions cover advanced analytical patterns.
- Tableau Prep integrates upstream data connectivity workflows so the same analyst can shape and visualize without switching tools.
- Geographic mapping with built-in geocoding is the strongest of the three platforms.
Where Tableau Lags: Collaboration and Total Cost of Ownership
- Desktop-first authoring blocks real-time multi-user editing on the same workbook.
- Tableau Server requires VM hosting, patching, and an administrator, all of which inflate the total cost of ownership beyond the per-seat sticker price.
- Tableau Pulse, the AI-summarization layer released to address the self-service analytics gap, requires a Tableau Cloud subscription and does not ship with Server deployments.
- Governance of calculated fields is by convention rather than by architecture, leaving room for metric drift across workbooks.
Power BI: Architecture, Strengths, and Licensing
Power BI is a BI platform that combines a Windows-only authoring app, a Microsoft-hosted publishing service, and a tabular semantic layer driven by the DAX formula language. Authoring happens in Power BI Desktop, sharing happens in Power BI Service, and on-prem publishing happens in Power BI Report Server for organizations that cannot route reports through the public cloud. The tabular model functions as a central definition store for measures, dimensions, and security filters before any report consumes them.
Data connectivity is the breadth advantage. Power BI Desktop ships with more than 100 native connectors, and DirectQuery enables live query access against SQL warehouses without copying data. The Azure-native connectors (Synapse, SQL Database, Data Lake Storage) deliver the lowest-latency paths because they ride on Microsoft's internal network. Any DAX formula written in the tabular model becomes available to every report that consumes that model, which is how Power BI achieves metric consistency at low cost.
Licensing is the most accessible of the three platforms. Power BI Pro at $14 per user per month grants full authoring and sharing inside an organization, Power BI Premium per capacity unlocks paginated reports and large semantic models for enterprise embed scenarios, and a Power BI Free tier exists for personal exploration but cannot share content with other users. Row-level security is configured in the data model through DAX filter expressions, which centralizes enforcement but creates a skills bottleneck for teams without a Power BI developer on staff. The underlying mode behavior is documented in the Microsoft Power BI documentation.
Where Power BI Leads: Microsoft Ecosystem Integration and Licensing Value
- Teams already on Microsoft 365, Azure Synapse, Azure Data Factory, or Teams get native single-sign-on, embed, and notification integrations without extra configuration.
- Power BI Pro at $14 per user per month is the lowest entry cost among full-featured tiers in this comparison.
- The DAX-driven tabular model gives central metric governance without buying a separate semantic layer product.
- Copilot for Power BI, available on Premium capacities, generates DAX expressions and narrative summaries from natural-language prompts.
Where Power BI Lags: Cross-Platform Authoring and Governance Depth
- Power BI Desktop runs only on Windows; Mac-first teams must use the web authoring experience (reduced functionality) or run Windows through Parallels or a remote desktop.
- Row-level security and object-level security require DAX expertise, creating dependency on a small group of model developers.
- Large-model support above the standard 1 GB dataset cap requires Premium capacity, which adds five-figure annual cost.
- Power BI Report Server (the on-prem option) trails the cloud service by several release cycles.
Looker: Architecture, Strengths, and Licensing
Looker is a BI platform that operates exclusively as a live-query router on top of a code-defined semantic layer called LookML. Every dashboard in Looker resolves to a SQL query generated from a LookML model, which is version-controlled in a Git repository and deployed through Looker's IDE. Looker never extracts or stores warehouse data in its own layer; it is, architecturally, a metrics compiler and query dispatcher rather than a data store.
The governance consequence is significant. Because every metric, join, and access rule lives in a LookML model, row-level security, field-level visibility, and metric definitions are enforced once in code and applied to every downstream explore and dashboard. This is the strongest data governance posture of the three platforms and the reason regulated industries (financial services, healthcare analytics) often select Looker despite the licensing cost. Connectivity is restricted to warehouses that support sub-second SQL: BigQuery, Snowflake, Redshift, and Databricks are the supported targets, with LookML model behavior documented in the LookML reference documentation.
Licensing is Google Cloud-managed SaaS only. The Standard edition starts at approximately $400 per month plus per-user fees, scaling through Embed, Enterprise, and Pro tiers as feature requirements grow. There is no on-prem option and no self-hosted edition. The current price tiers are published in the Google Cloud Looker pricing documentation. The LookML learning curve is the practical gate: most deployments need at least one engineer or senior analyst dedicated to model development, which is the structural reason small teams often reach for the alternatives cataloged in Looker Alternatives for Small Businesses.
Where Looker Leads: Governed Semantic Layer and Embedded Analytics
- The LookML semantic layer guarantees every report draws from the same metric definitions by construction, not by convention.
- Looker's Embed SDK and Looker API are the most documented embedded analytics paths in this comparison, used by SaaS vendors to ship customer-facing dashboards inside their own products.
- Git-based deployment of the LookML model makes peer review, rollback, and change history first-class data governance primitives.
- BigQuery integration is the deepest of the three platforms because both products are Google Cloud-native.
Where Looker Lags: Cost and LookML Skill Requirements
- Minimum contract pricing prices out most sub-100-user departments.
- LookML demands developer skills; business analysts cannot self-serve model changes the way they can edit a Tableau workbook or a Power BI report.
- Google Cloud-only delivery limits buyer flexibility for AWS-first or Azure-first organizations.
- Embedded analytics outside Google Cloud requires careful egress and latency planning.
Platform Comparison: Data Connectivity, Governance, and Embedding
Choosing the right BI tool across these three options requires looking past the marketing surface at six concrete capabilities: how each tool stores data, where it enforces metric definitions, how it scopes row-scoped access, what its embedded analytics path looks like, how broad its connector library is, and what authoring interface analysts use day to day. The table below synthesizes the architecture comparison, and the second table summarizes licensing and total cost of ownership for mid-market deployments. Vendor analyst placements are tracked annually in the Gartner Magic Quadrant for Analytics and Business Intelligence Platforms.
| Platform | Data Storage Model | Semantic Layer | Tenant-row filter | Embedded Analytics | Native Connectors | Primary Authoring Interface |
|---|---|---|---|---|---|---|
| Tableau | Extract or Live Connection | Partial; calculated fields and published data sources | User filters and entitlement tables, per data source | JavaScript API and Embedding API v3 | 80+ native; broad cloud and SaaS coverage | Tableau Desktop (Windows or macOS) |
| Power BI | Import (tabular model) or DirectQuery | Tabular model with DAX measures; strong | DAX filter rules in the tabular model | Power BI Embedded on Azure capacity | 100+ native; deepest Microsoft stack coverage | Power BI Desktop (Windows only) |
| Looker | Direct query only; no extract | LookML; code-defined, version-controlled, strongest | LookML access filters and access grants | Embed SDK with documented JWT auth flow | Limited to modern cloud warehouses | Looker IDE (browser only) |
| Platform | Entry Tier and Price | On-Prem Option | Windows-Only Authoring | Suitable Team Size |
|---|---|---|---|---|
| Tableau | Creator at approximately $70 per user per month on Tableau Cloud | Yes, via Tableau Server | No; macOS supported | 5 to 500+ trained analysts |
| Power BI | Pro at approximately $10 per user per month | Yes, via Power BI Report Server with Premium | Yes, for full authoring; web authoring is reduced | 5 to 500+ in any Microsoft shop |
| Looker | Standard from approximately $400 per month plus per-user fees | No | No; browser only | 50+ with a dedicated LookML developer |
The architecture table makes the buyer split visible. Looker wins the data governance row by construction because the metric layer is the product. Power BI wins the cost row because the tabular model gives most of the governance benefit at a tenth of the contract price. Tableau wins the authoring row because Desktop remains the most productive surface for an analyst who knows the tool. These are not rankings; they are the differentiators that determine which platform a procurement team can actually defend.
The TCO table forces a second conversation. A 50-seat Looker deployment lists well above a 50-seat Power BI Pro deployment before LookML developer salary is added. A 50-seat Tableau Cloud deployment lands in the middle, with the catch that Tableau Cloud self-hosting adds infrastructure and admin cost not reflected in per-seat pricing. The governance vs cost tradeoff also frames the broader debate covered in Self-Service BI vs Traditional Analytics and the head-to-head detail in Enterprise Analytics: Power BI vs Tableau. Academic treatment of unified data model query optimization and OLAP cardinality estimation can be found in IEEE Transactions on Knowledge and Data Engineering.
Choosing the Right BI suite: A Buyer Decision Framework
Selecting a Analytics platform for a mid-market team requires matching the platform to the data stack, the analyst skill mix, and the budget envelope already on the table. The four archetypes below cover the majority of departmental procurement cases, and most teams that misfire on selection have ignored one of the three constraints.
- Microsoft-stack team with Azure or Microsoft 365 deployed. Power BI is the lowest-friction and lowest-cost starting point. Budget for DAX skill development if data governance maturity is a goal; otherwise expect metric drift inside 12 months.
- Data-visualization-first team with trained analysts owning custom dashboards. Tableau Desktop authoring depth is the differentiator. Budget for Creator seats, Tableau Cloud subscription, and one administrator if the deployment includes Tableau backend.
- Data engineering team using dbt, BigQuery, or Snowflake as the source of truth that needs governed metrics. Looker LookML is architecturally aligned with this pattern. Budget for one dedicated LookML developer and Google Cloud licensing; expect a six-to-twelve-week ramp before self-service analytics is viable for business users.
- Product team embedding analytics inside a customer-facing SaaS application. Evaluate the embedded BI SDK quality first. Looker and Sigma (covered in the SMB alternatives piece) lead on documentation, white-label theming, and JWT-based authentication. Power BI Embedded is the strongest pick for Azure-native products; Tableau's Embedding API v3 fits when the host app already runs JavaScript-heavy dashboards.
Mixed-platform deployments are common and viable. Some enterprises run Power BI for internal self-service analytics alongside Looker for the customer-facing in-app analytics layer of a SaaS product. The architecture works, but it introduces a dual-semantic-layer risk: if a metric like monthly recurring revenue is defined in the Power BI tabular model and again in LookML, the two definitions will drift, and finance will surface the gap during a board prep cycle. Anchor the canonical definition in one layer and reference it from the other. Most CRM-driven BI work starts from the master record store described in CRM as a System of Record, which is usually the first data domain a new BI solution onboards.
Further reading
- CRM as a System of Record for the upstream data layer most BI deployments connect to first.
- Realtime Analytics In CRM and Sales Platforms for the operational reporting patterns that drive live-query architecture choices.
- Looker Alternatives for Small Businesses for SMB teams priced out of the Standard tier.
- Common Challenges With Traditional Analytics for the architectural debt that modern Analytics suites address.
Frequently Asked Questions
Can Power BI and Tableau both connect to the same Snowflake warehouse without duplicating data?
Both Power BI and Tableau can connect to Snowflake using DirectQuery and Live Connection respectively, so neither tool needs to copy data into a separate store. The practical consideration is query cost: every dashboard load in live-query mode triggers Snowflake compute credit consumption, so high-user-count deployments can sharply increase warehouse billing. Teams running both tools against the same warehouse should enforce query governance through Snowflake resource monitors and warehouse auto-suspend policies to prevent runaway dashboard traffic from exhausting compute budgets.
How long does it take to build a functional LookML definition for a new Looker deployment?
A minimal LookML codebase that connects one data source, defines core dimensions and measures, and ships a working dashboard typically takes a skilled analyst or junior data engineer two to four weeks from a standing start. The timeline assumes familiarity with the warehouse schema; teams beginning without documented data models should budget an extra one to two weeks for schema discovery. Complex deployments with multiple joined explores, per-row access rules, and derived tables extend the timeline to six to twelve weeks before the model is stable enough for self-service use by non-technical report consumers.
What is the practical governance difference between Tableau calculated fields and Looker LookML measures?
A Tableau calculated measure is defined per workbook, so two analysts can produce two different revenue calculations in two workbooks with no system-level check for consistency. LookML measures are defined once in the model and shared across every explore, so every dashboard that references revenue resolves to the same definition by construction. The governance consequence is concrete: Tableau requires organizational process (naming standards, shared data source publishing, peer review of computed fields) to achieve metric consistency, whereas Looker enforces it architecturally. Teams where metric disagreement between departments is a recurring problem often cite this gap as the primary driver for adopting Looker over Tableau despite the higher licensing cost.