Power BI is a cloud-native business intelligence platform that connects, models, and visualizes enterprise data across the Microsoft Fabric ecosystem. Tableau covers the same job with a different architecture: a drag-and-drop authoring model built around VizQL rather than Power BI's DAX-driven tabular model. Enterprise buying teams weighing the two need more than a feature checklist, because the two products differ far more in architecture than in data visualization surface features. Data modeling architecture, licensing structure, and governance controls, especially Row-Level Security, determine whether either enterprise analytics platform actually scales past a pilot deployment into a large-team rollout.
How Power BI and Tableau Approach Enterprise Analytics
Power BI and Tableau solve the same three-step enterprise analytics problem: connect to enterprise data sources, apply a data model, and surface interactive dashboards and data visualization. Power BI is the business-intelligence layer inside Microsoft Fabric, according to Microsoft's Power BI product page. Tableau instead renders drag-and-drop field assignments into queries through VizQL, authored in Tableau Desktop and published to Tableau Server or Tableau Cloud. Both platforms support two connection modes: an extract that copies source data into Power BI or Tableau, and a live connection that passes queries to the source at render time. The primary authoring model and the data governance layer of each business intelligence platform diverge from there. That split is explored at platform breadth in the BI Platforms Compared: Tableau, Power BI, and Looker hub; this comparison goes deeper on enterprise data modeling and governance specifically, past the friction points covered in Common Challenges With Traditional Analytics.
- Extract / Import mode
- Power BI Desktop copies source data into its in-memory tabular model; Tableau Desktop builds an equivalent local extract file for offline analysis and faster query performance.
- Live connection
- Power BI calls this DirectQuery, passing queries to the source database at render time; Tableau calls the equivalent mode Live Connection, with the same query-at-render-time behavior.
- Semantic layer
- Power BI centralizes metric definitions in one DAX tabular model shared across reports; Tableau defines calculated fields per workbook, so there is no single enforced semantic layer.
Power BI: Data Modeling, Licensing, and Microsoft Ecosystem Integration
Power BI is a BI platform that authors reports almost entirely through Power BI Desktop, which requires Windows 10 or Windows Server 2016 or later, per Microsoft's Power BI Desktop requirements documentation. Desktop authoring produces .pbix files published to the Power BI Service. The DAX-based tabular model is Power BI's semantic layer, and Row-Level Security is implemented as DAX filter rules defined inside that same tabular model, according to Microsoft's Row-Level Security documentation. The documentation defines Row-Level Security roles and DAX filter expressions inside the semantic model; how changes propagate to downstream reports depends on the model's deployment.

Data connectivity splits into two modes. Import mode copies data into the in-memory tabular model for fast local queries; DirectQuery passes queries live to the source at render time instead, trading a higher data-volume ceiling for added query latency, per Power BI's DirectQuery documentation. Licensing runs on three per-user tiers: Fabric (Free), Power BI Pro, and Power BI Premium Per User, according to Microsoft's Power BI licensing documentation. Power BI Pro costs $14.00 per user per month paid yearly, and Power BI Premium Per User (PPU) costs $24.00 per user per month paid yearly, per Microsoft's Power BI pricing page. Free-license users can build reports for personal use but cannot share or collaborate; sharing requires Power BI Pro or PPU, or free users viewing content hosted on Premium or Fabric F64+ capacity. Ceilings scale sharply across the three tiers: model memory size is 1 GB on the free tier and 100 GB on Power BI Pro, dataset refreshes run 8 per day on the free tier and 48 per day on both Power BI Pro and PPU, and max native storage runs 10 GB per license on the free tier and 100 TB on Power BI Pro. Microsoft lists PPU model memory and native storage as varying with the underlying capacity rather than as a fixed number. Power BI Premium also unlocks paginated reports, advanced AI features, and dataflows, according to Power BI's Premium overview documentation. Tight Microsoft 365, Teams, and Azure integration round out the ecosystem fit for organizations already standardized on Microsoft's stack.
- Native Microsoft 365, Teams, and Azure integration for report distribution
- DAX tabular semantic layer centralizes metric governance and model-level Row-Level Security
- Power BI Premium adds paginated reports, advanced AI features, and dataflows for large-scale workloads
- DirectQuery keeps datasets that exceed import limits queryable without a full data copy
Where Power BI Leads in Enterprise Deployments
Power BI's deepest advantage is native ecosystem gravity: Teams and SharePoint embedding, Azure data-source connectors, and Microsoft 365 licensing bundles reduce procurement friction for enterprises already on that stack. The DAX tabular semantic layer centralizes both metric definitions and Row-Level Security in one governed model, so a single rule change enforces access control across every downstream report, per Microsoft's Row-Level Security documentation. Premium capacity extends that governance to paginated reports and advanced AI workloads at scale.
Power BI Constraints for Large Teams
Power BI Desktop authoring requires Windows 10 or Windows Server 2016 or later, per Microsoft's Power BI Desktop requirements documentation. Row-Level Security requires DAX expertise, which creates a governance bottleneck around whoever owns the tabular model. Free-tier users cannot share or collaborate at all, and the free tier's 1 GB model memory limit and 8-refresh-per-day ceiling push any real workload to Power BI Pro at minimum, and teams that need Premium capacity features on top of the Pro ceilings pay $24.00 per user per month for Power BI Premium Per User, per Microsoft's Power BI pricing page and Microsoft's Power BI licensing documentation.
Tableau: Visualization Depth, Authoring Model, and Licensing
Where Power BI prioritizes Microsoft ecosystem integration, Tableau is a BI platform built around visualization depth and cross-platform authoring. Tableau Desktop installs on either a Windows computer or a Mac computer, unlike Power BI Desktop's Windows-only authoring, according to Tableau's Desktop deployment documentation. A paid Tableau Desktop license connects to Tableau Server or Tableau Cloud to publish and share content; Tableau Desktop Public Edition is not for commercial use and analyzes up to 15 million rows, per Tableau's Desktop edition comparison documentation. VizQL renders drag-and-drop field assignments into queries against the connected data source.
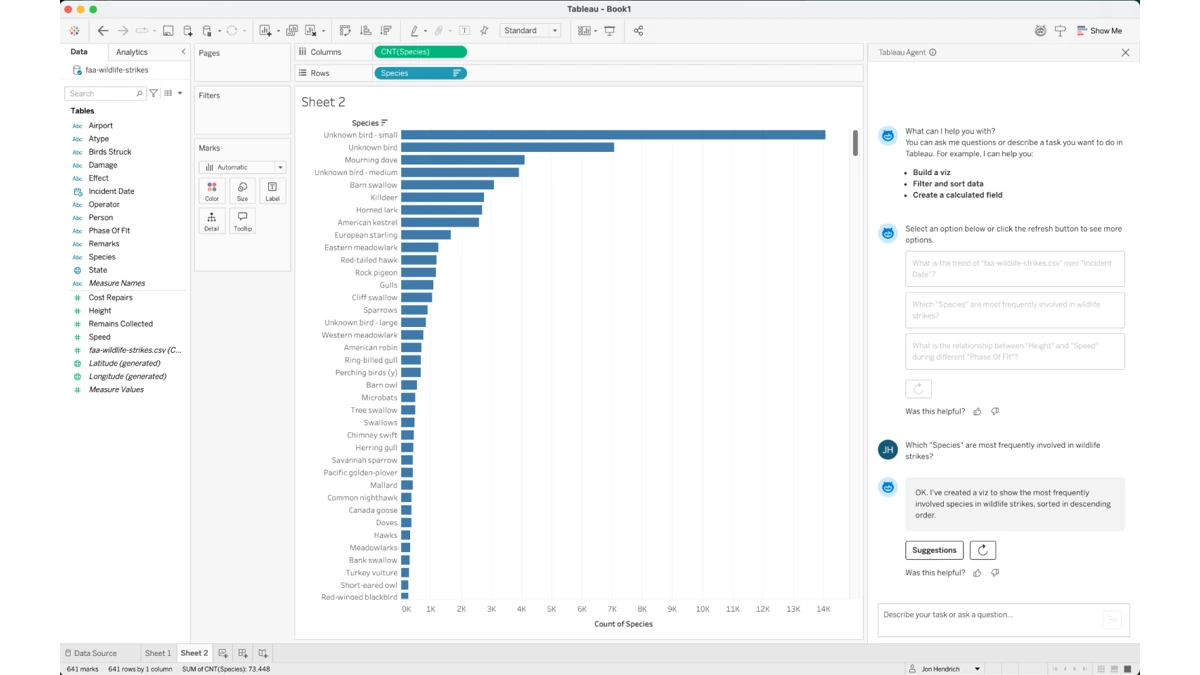
Calculated fields give analysts precise control over metrics without writing SQL, per Tableau's functions reference documentation. Story points enable narrative data presentations across multiple views, and dashboard actions, including filter actions, highlight actions, and URL actions, allow interactive analysis without code, per Tableau's story points documentation and Tableau's dashboard actions documentation. Tableau Prep handles data shaping ahead of visualization, per Tableau Prep documentation. Licensing runs on three license roles on Tableau Server and Tableau Cloud: Creator, Explorer, and Viewer, according to Tableau's license overview documentation, and installing Tableau Desktop requires purchasing a Creator license or holding an existing Creator role on Tableau Server, per Tableau's Desktop deployment documentation. No fetchable primary Tableau source publishes a current per-seat dollar figure, so the real cost driver is the Creator-role requirement plus Tableau Server infrastructure and admin overhead, not a flat price. On governance, Tableau supports multiple Row-Level Security methods: a manual user-filter mapped to specific users, which the documentation states must be done per workbook, a dynamic filter built from a calculated field using the USERNAME() function, and virtual-connection data policies, which centralize Row-Level Security across all content using the connection, per Tableau's Row-Level Security options documentation. Tableau's governance blueprint also covers Tableau Catalog and hybrid live-query-versus-extract architecture, per Tableau's Blueprint governance documentation.
- Tableau Desktop authors natively on Windows or Mac, unlike Power BI Desktop's Windows-only model
- Calculated fields and table calculations give trained analysts deep visualization expressiveness
- Tableau Prep shapes data before it reaches a workbook
- Story points assemble narrative, executive-facing data presentations across multiple views
Where Tableau Leads in Enterprise Deployments
Cross-platform Desktop authoring on Windows or Mac removes a hardware constraint that Power BI Desktop's Windows-only requirement imposes, per Tableau's Desktop deployment documentation. For trained analysts, calculated fields and table calculations offer more granular visualization control than Power BI's DAX-first workflow. Tableau Prep shapes messy source data ahead of analysis, and story points package findings into narrative presentations for executive audiences.
Tableau Constraints for Large Teams
Tableau has no centralized Row-Level Security model; it offers multiple RLS methods, and the manual user-filter approach must be configured per workbook rather than once at the model level, per Tableau's Row-Level Security options documentation. Tableau Server infrastructure adds hosting and admin cost on top of Creator-role licensing. No published primary-source per-seat price exists for Tableau, which makes upfront budgeting harder than Power BI's flat published tiers.
Head-to-Head Comparison: Data Modeling, Governance, and Licensing
Power BI and Tableau diverge most sharply on architecture and licensing structure, not raw feature counts. Power BI Desktop requires Windows 10 or Windows Server 2016 or later, while Tableau Desktop runs on Windows or Mac, according to Microsoft's Power BI Desktop requirements documentation and Tableau's Desktop deployment documentation. The tables below map data modeling, governance, and licensing side by side.
| Platform | Primary Authoring Tool | Data Modeling Layer | Semantic Layer | Row-Level Security | Platform Dependency | Live Connection Support |
|---|---|---|---|---|---|---|
| Power BI | Power BI Desktop (Windows 10 or Windows Server 2016 or later) plus reduced-function web authoring | DAX-based tabular model built and refreshed in Power BI Desktop | Centralized DAX tabular model shared across every report built on the dataset | DAX filter rules defined once inside the tabular model | Power BI Desktop authoring requires Windows; no native Mac client | DirectQuery passes queries to the source at render time instead of importing data |
| Tableau | Tableau Desktop, installs on Windows or Mac | VizQL with calculated fields defined per data source or workbook | Per-workbook calculated fields; no single centralized semantic model | Multiple methods, including a manual user-filter configured per workbook and a USERNAME()-based dynamic filter | Tableau Desktop runs natively on both Windows and Mac | Live Connection queries the source directly; extracts import a data snapshot instead |
Data modeling philosophy explains most of the downstream licensing and governance differences. Power BI's DAX tabular model gives enterprises one place to enforce Row-Level Security and metric consistency, a pattern examined in more depth in Self-Service BI vs Traditional Analytics. Tableau's per-workbook calculated fields give individual analysts more flexibility but push data governance enforcement onto process and review rather than onto the product itself.
| Platform | Entry Tier | Entry Price | On-Prem Publishing Option | Embedded Analytics | Best-Fit Organization |
|---|---|---|---|---|---|
| Power BI | Power BI Pro | $14.00 per user per month, paid yearly | Power BI Report Server, requires Premium capacity | Power BI Embedded, priced separately from per-user licensing | Enterprises already standardized on Microsoft 365 or Azure |
| Tableau | Creator role on Tableau Server or Tableau Cloud | No published per-seat dollar figure; cost driver is Creator-role licensing plus Server infrastructure and admin overhead | Tableau Server, self-hosted on-premises or in a private cloud | Tableau Embedded Analytics | Analytics teams already running Tableau Server or Tableau Cloud infrastructure |
Total cost of ownership (TCO) tells a different story than the sticker price alone. Power BI Pro's $14.00 per user per month is a fixed, published number that scales linearly with headcount, per Microsoft's Power BI pricing page. Tableau's Creator-role licensing requires Tableau Server deployment and license administration, a cost structure closer to how enterprises budget for a cloud data warehouse, covered separately in Snowflake vs BigQuery vs Redshift Pricing Comparison. Neither product is categorically cheaper; from the published pricing cited above, total cost of ownership depends on which infrastructure and governance model the enterprise is already paying to maintain.
Choosing Between Power BI and Tableau for Enterprise Deployment
Power BI and Tableau fit different enterprise starting points more than they compete head-on for the same buyer. Three archetypes cover most enterprise deployment decisions.
- A Microsoft-stack enterprise already running Azure or Microsoft 365 gets the lowest-friction entry point from Power BI Pro at $14.00 per user per month, per Microsoft's Power BI pricing page. Budget for DAX skill investment, since Row-Level Security governance depends on it.
- An analytics-first enterprise with trained data analysts who need cross-platform Desktop authoring on Windows or Mac should weigh Tableau's Creator-role authoring depth and calculated-field flexibility. Budget for Creator seats plus Tableau Server or Tableau Cloud infrastructure, since no fixed per-seat price is published.
- An enterprise that needs the strongest centralized metric governance, with a dedicated BI developer resource, should weigh Power BI's DAX tabular semantic layer and model-level Row-Level Security, centralized but DAX-dependent, against Tableau's multiple RLS methods configured per workbook, flexible but reliant on organizational process for consistency.
Some organizations run both: Power BI for internal self-service reporting alongside Tableau for analyst-built custom dashboards. That mixed deployment is viable, but it requires dual semantic-layer governance to keep metric definitions from diverging across the two tools.
Further reading
Frequently Asked Questions
Which is more cost-effective for large organizations, Power BI or Tableau?
Power BI publishes a clear per-seat price, while Tableau does not. Power BI Pro costs $14.00 per user per month paid yearly and Power BI Premium Per User costs $24.00 per user per month paid yearly, per Microsoft's Power BI licensing documentation and Microsoft's Power BI pricing page. Tableau Server and Tableau Cloud use license roles instead, with Creator, Explorer, and Viewer as the three tiers, per Tableau's license overview documentation, and installing Tableau Desktop requires a purchased Creator license or an existing Creator role on Tableau Server, per Tableau's Desktop deployment documentation. No current primary Tableau source publishes a specific per-seat dollar figure, so a like-for-like price comparison is not possible from verified sources. The more reliable comparison is total cost of ownership, since Tableau Server requires on-premises hosting and admin overhead that Power BI Pro, a fully managed cloud service, does not carry.
Can Power BI handle large datasets effectively at enterprise scale?
Power BI dataset ceilings scale sharply by license tier. The free tier caps model memory size at 1 GB, allows 8 dataset refreshes per day, and limits native storage to 10 GB per license, while Power BI Pro raises model memory to 100 GB, allows 48 refreshes per day, and extends native storage to 100 TB; Power BI Premium Per User keeps the 48 refreshes per day and lists model memory and native storage as varying with the underlying capacity, per Microsoft's Power BI licensing documentation and Microsoft's Power BI pricing page. For datasets that still exceed those limits, DirectQuery mode avoids importing data into the tabular model entirely by passing queries to the source database at render time, per Power BI's DirectQuery documentation, which trades a higher dataset ceiling for query latency and load on the source system. Enterprises with multi-gigabyte datasets should budget for Premium Per User rather than assume the free or Pro tier shared-capacity limits will scale.
How does Row-Level Security implementation differ between Power BI and Tableau?
Power BI and Tableau enforce Row-Level Security in fundamentally different places. Power BI implements it as DAX filter rules defined inside the tabular data model in Power BI Desktop, per Microsoft's Row-Level Security documentation, so the rules live in one centralized model and apply consistently to every report built on that dataset. Tableau instead supports multiple Row-Level Security methods rather than one centralized model, per Tableau's Row-Level Security options documentation: a manual user-filter mapped to specific users, which the documentation states must be done per workbook, and a dynamic user filter built from a calculated field that uses the USERNAME() function. Power BI's Row-Level Security is defined as DAX filter rules in its semantic model, while a Tableau manual user-filter has to be reconfigured workbook by workbook. Enterprise security teams with strict data-access compliance requirements should factor that per-workbook maintenance burden into their Tableau governance planning.