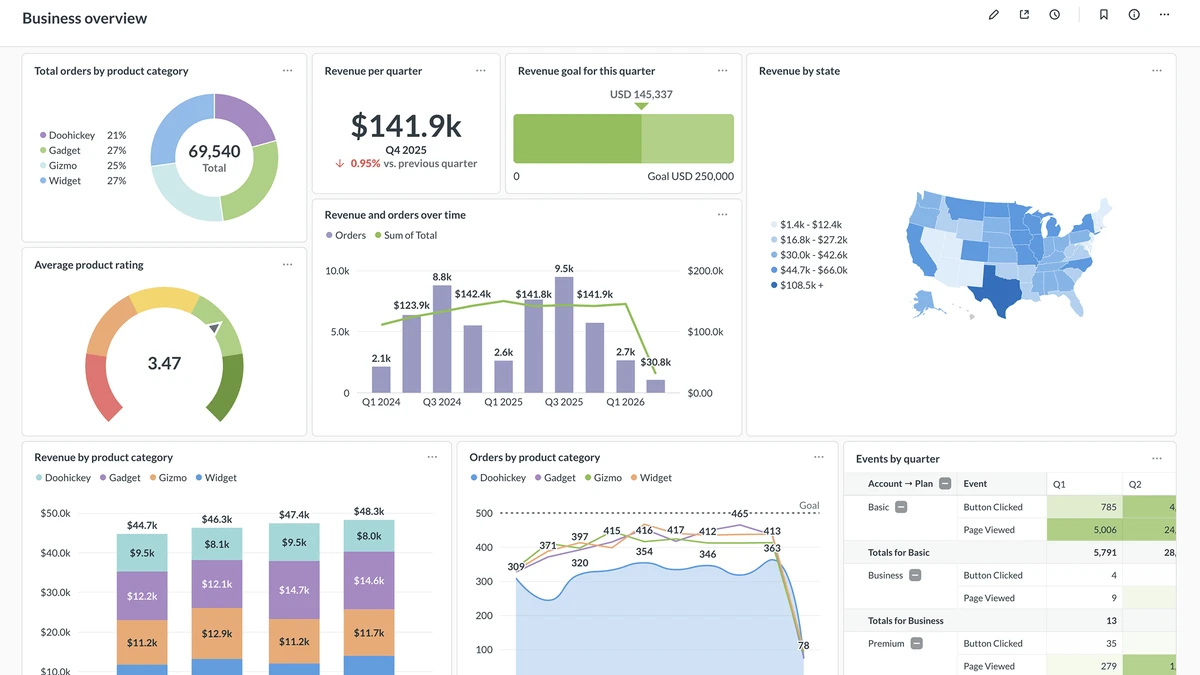
Business intelligence tools is a category of software that transforms raw organizational data into actionable dashboards, reports, and visualizations for decision-makers. For a small business running on tight margins, the question is not whether to use BI tools but which ones cost nothing to start. Power BI, Looker Studio, and Metabase each offer a free tier, yet each trades off differently on data connectors, sharing permissions, and infrastructure requirements. Picking the wrong one means rebuilding your dashboards six months later when a licensing wall appears.
What Business Intelligence Tools Actually Do
Business intelligence tools sit between raw data sources and the humans who need to act on that data. They query databases, spreadsheets, advertising platforms, and cloud services, then surface results as interactive dashboards and charts that update automatically. Without a BI layer, a small business analyst typically exports CSVs from five systems, pastes them into a spreadsheet, builds pivot tables manually, and repeats the process weekly. A BI tool replaces that cycle with a live connection.
The core functions are data visualization, automated refresh, and sharing. Data visualization translates numeric output into bar charts, line graphs, pie charts, and geographic maps that non-technical stakeholders can read without SQL knowledge. Automated refresh pulls updated data on a schedule, so a Monday morning sales report reflects Friday's close without anyone running a query. Sharing distributes those views to colleagues, investors, or clients through a URL, an embedded iframe, or a PDF export.
The common challenges with traditional analytics approaches include version-controlled spreadsheet sprawl, broken formulas after personnel changes, and no audit trail on who changed what. BI tools address each of these by centralizing the data model and separating the presentation layer from the source system. Interactive dashboards let users filter by date range or segment without touching underlying data.
The Three Leading Free Options Compared
Three business intelligence tools dominate the free tier for small businesses: Power BI, Looker Studio, and Metabase. The table below covers the five axes that matter most for a small business evaluating each option before committing to a data stack.
| Dimension | Power BI Fabric Free | Looker Studio | Metabase Open Source |
|---|---|---|---|
| Free tier name | Fabric Free (individual) | Looker Studio (fully free) | Open Source (self-hosted) |
| Sharing limits | No sharing to colleagues; requires Pro or Premium Per User for workspaces | Share via link or embed with any Google account; no paid tier needed | No user cap on self-hosted instance; sharing is internal to your server |
| Data connectors | DirectQuery to SQL databases, Excel, SharePoint, Azure services; 100+ connectors | 1,000+ community and Google-native connectors via the connector gallery | Direct SQL to PostgreSQL, MySQL, MongoDB, Snowflake, BigQuery, and 15+ others |
| Self-hosting option | No (cloud-only SaaS) | No (cloud-only SaaS) | Yes (Docker or JAR on your own infrastructure) |
| Best-fit use case | Solo analyst on Microsoft 365 building personal reports | Marketing or e-commerce team already using Google Ads and Google Sheets | Technical team wanting direct warehouse access with no per-seat fees |
Looker Studio: Browser-First Reporting with 1,000+ Connectors
Looker Studio is the business intelligence tool Google provides at no cost, requiring no software installation and no credit card. Any Google account can create and share reports using the platform's connector gallery, which lists over 1,000 data connectors covering Google Ads, Google Analytics, BigQuery, YouTube Analytics, Facebook Ads via partner connectors, and dozens of SaaS tools. For a small business already running Google Workspace, the integration friction is near zero.
Looker Studio renders interactive dashboards with date-range controls, segment filters, and drill-down charts. Reports are shareable via a URL or embedded in a web page without any per-viewer fee. The platform stores all report definitions in Google Drive, meaning version history and access control follow the same permissions model the team already uses for documents.
Key capabilities on the free tier:
- Native connectors to all Google Marketing Platform products with no additional setup
- Calculated fields and blended data sources that join up to five sources in a single chart
- Scheduled email delivery of report snapshots to stakeholders
- Template gallery with pre-built e-commerce, SEO, and paid-media dashboard layouts
- Embedding via iframe for client-facing portals
The tradeoff is latency on large datasets. Looker Studio queries data connectors on page load, so reports backed by millions of rows in a slow connector can take 10 to 30 seconds to render. Teams with significant query volume should cache results in BigQuery or Google Sheets first. For background on how this compares to traditional reporting stacks, the self-service BI vs traditional analytics explainer covers the architectural tradeoffs in detail.
Power BI Fabric Free: Microsoft Ecosystem Depth with Collaboration Limits

Power BI Fabric Free is the individual-use business intelligence tool that Microsoft provides at no charge, allowing a single user to build reports in the desktop application and publish them to the cloud service. The license grants access to that desktop application, which is a full-featured data visualization and modeling tool, and to personal workspaces in the cloud service where users can view their own published reports. Per Microsoft's documentation on service features by license type, Fabric Free users can create reports and publish to personal workspaces but cannot share those reports with colleagues or publish to shared workspaces.
For a solo analyst or a business owner who needs personal dashboards, that constraint is manageable. For any team workflow where multiple people need to view a shared sales report or a live inventory dashboard, Power BI requires a paid license. According to Microsoft's end-user license documentation, consuming shared content requires either a Power BI Pro license or access to a Premium capacity workspace.
Strengths of the Fabric Free tier for eligible users:
- Power BI Desktop includes a full DAX (Data Analysis Expressions) formula engine for complex calculated measures
- DirectQuery mode connects to SQL Server, Azure SQL, PostgreSQL, and other databases without importing data
- Native integration with Excel PivotTables via the Analyze in Excel feature
- Power Query M language for data transformation covers most ETL needs without writing SQL
- Over 100 visual types including custom community visuals from the AppSource marketplace
Organizations considering Power BI should review Microsoft's self-service signup and purchase guidance before planning a team rollout, since the path from Fabric Free to Pro licensing involves organizational tenant settings that an IT administrator typically needs to configure.
Metabase Open Source: Self-Hosted BI with Direct Warehouse Queries
Metabase open source is a self-service analytics business intelligence tool that runs on your own infrastructure and connects directly to your data warehouse or production database. The open source edition is free with no user cap, no query limits, and no feature expiration. A team of 50 analysts can run full reports on a single self-hosted instance without paying a per-seat fee, which positions Metabase as the most cost-effective option for growing teams with technical capacity to manage a server.
The platform supports direct SQL connections to PostgreSQL, MySQL, MariaDB, SQL Server, MongoDB, Snowflake, BigQuery, Redshift, and other data warehouse targets. A non-technical user can build questions using the graphical query builder, while developers can write native SQL for advanced analysis. Both outputs render in the same interactive dashboards with filter controls and drill-through capability.
Open source edition capabilities:
- Graphical question builder for non-SQL users covering filters, grouping, aggregation, and sorting
- Native SQL editor for custom queries with variable parameters for interactive filtering
- Automated dashboard subscriptions that email PDF snapshots on a schedule
- Row-level permissions tied to user attributes for multi-tenant data access control
- Docker deployment in under 15 minutes for teams with basic container experience
The open source edition does not include SSO (single sign-on), audit logs, or sandbox row-level security, which are features in the paid Metabase Pro and Enterprise tiers. For teams that need those controls, the Power BI vs Tableau for enterprise analytics comparison covers the governance features available at the paid end of the BI market. Metabase's open source model means the community maintains a library of database drivers and the codebase is auditable, which matters for organizations with data residency requirements.
How to Choose the Right Free BI Tool for Your Business
Selecting among business intelligence tools comes down to three variables: where your data lives, how many people need to view dashboards, and whether your team can manage a server. Small business operators without IT staff should rule out self-hosted options early. Teams with all data in Google products have a clear default. Microsoft 365 shops face a harder call because the free Power BI tier excludes the collaboration features most teams actually need.
Follow this sequence to arrive at the right choice:
- Map your data sources. List every system that holds data you want to report on: CRM, e-commerce platform, advertising accounts, accounting software, spreadsheets. If three or more are Google products, Looker Studio is the lowest-friction starting point.
- Count your report consumers. If more than one person needs to view live dashboards, Power BI Fabric Free is eliminated. Looker Studio and Metabase open source both support multiple viewers without additional licensing cost.
- Assess your infrastructure tolerance. Metabase requires a server, database driver configuration, and ongoing maintenance. If no one on the team is comfortable with Docker or a Linux command line, choose a cloud-hosted option.
- Check connector coverage. Verify that your primary data source has a supported connector. Looker Studio's gallery covers most SaaS marketing tools; Metabase requires a direct database connection or a data warehouse intermediary; Power BI covers the Microsoft ecosystem deeply but third-party SaaS connectors often require a paid gateway.
- Prototype before committing. All three platforms allow report creation within an hour. Build one dashboard on each shortlisted option using real data before standardizing the team on a single tool.
For teams that outgrow these free tiers, the Looker alternatives for small businesses overview covers mid-market paid options that maintain self-service analytics without requiring a full enterprise contract. The self-service analytics posture each tool supports differs enough that switching later carries real migration cost, so the upfront evaluation matters.
Implementation Steps: Getting Your First Dashboard Live
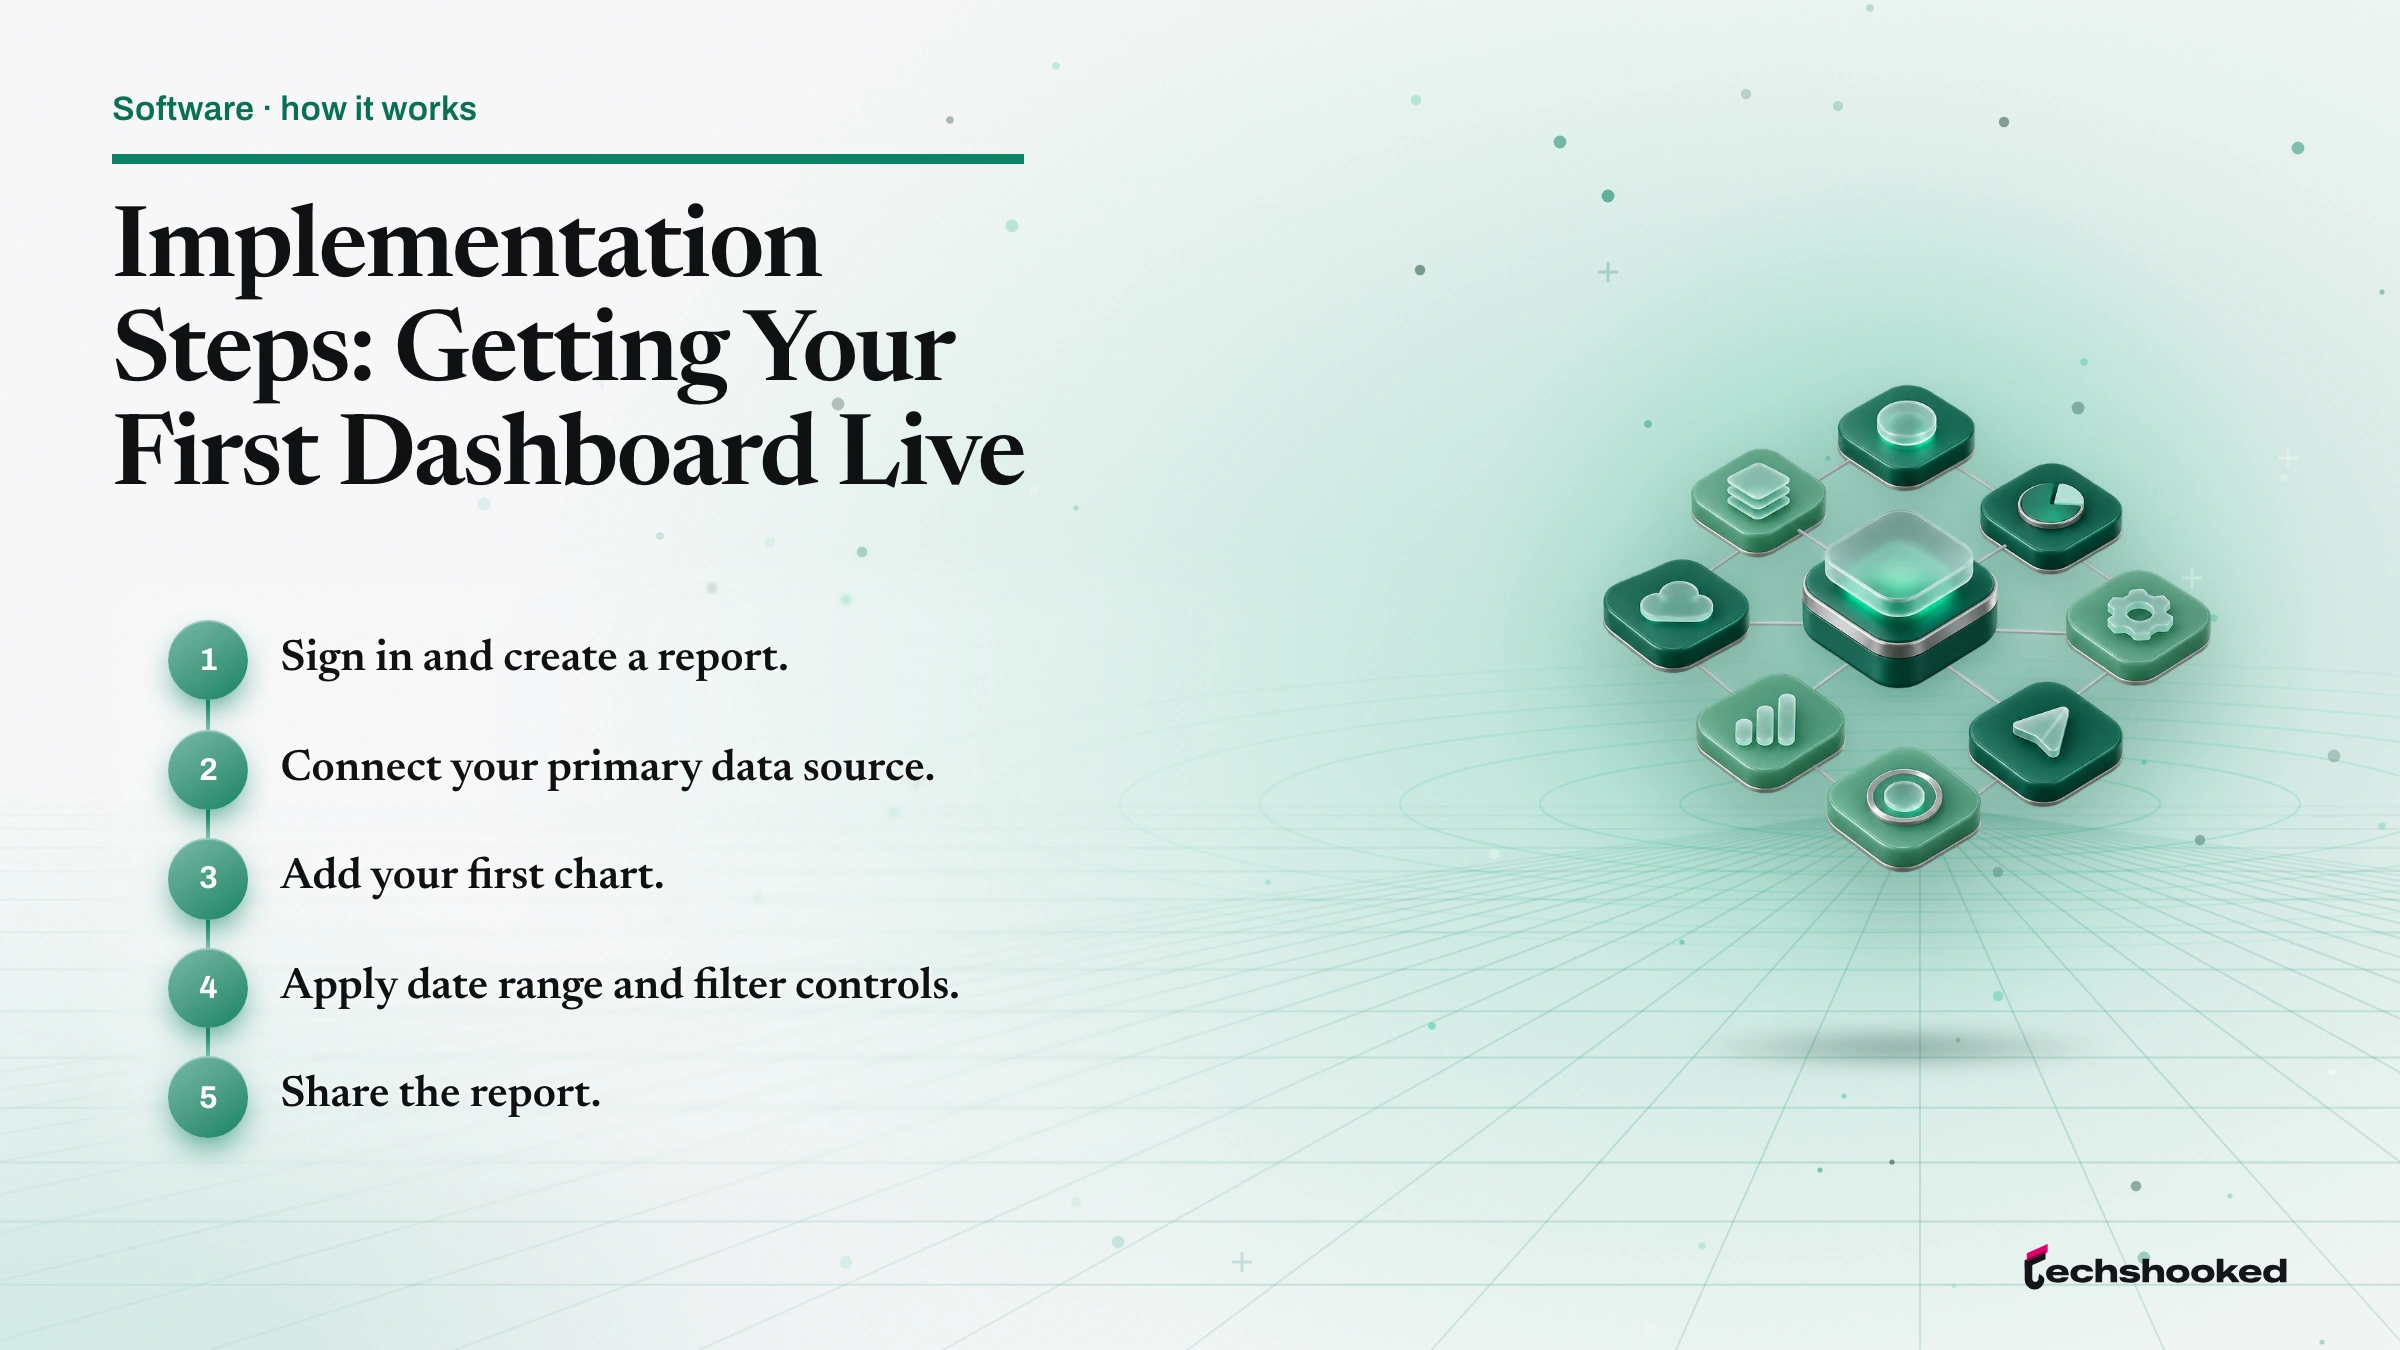
All three business intelligence tools allow a first dashboard to go live in under two hours, with Looker Studio offering the lowest barrier for teams without a dedicated data engineer. The steps below follow the Looker Studio path; the connector setup differs for Power BI and Metabase, but the logical sequence is identical.
- Sign in and create a report. Navigate to Looker Studio and click "Blank Report." The platform immediately prompts you to add a data source.
- Connect your primary data source. Select from the connector gallery. For Google Sheets, choose the Sheets connector and authorize access. For Google Analytics 4, select the GA4 connector and pick your property. The data schema appears as a field list on the right.
- Add your first chart. Click "Insert" and choose a chart type. Drag a dimension (such as date or campaign name) to the dimension slot and a metric (such as sessions or revenue) to the metric slot. The chart renders with live data immediately.
- Apply date range and filter controls. Add a date range control from the toolbar so viewers can adjust the reporting window without editing the report. Add a filter control for any dimension users will need to segment by.
- Share the report. Click "Share" in the top-right corner. Set access to "Anyone with the link can view" for broad distribution, or restrict to specific Google accounts for internal use. Copy the link and distribute it to stakeholders.
For Power BI or Metabase implementations, the connector setup differs but the logical sequence is identical: connect a data source, define the query or data model, build the visualization, and distribute access. Each platform's official documentation covers the connector-specific steps in detail.
Further reading
- Microsoft Learn: Power BI service features by license type
- Microsoft Learn: Power BI end-user license types and capabilities
- Microsoft Learn: Power BI self-service signup and purchase
- Metabase pricing and open source edition details
- Looker Studio connector gallery
- CRM Tools Compared: Salesforce, HubSpot, Zoho For Mid-Market Selection
- HubSpot vs Salesforce For Enterprises: Architecture, TCO, and Decision Framework
- Martech Stack vs CRM Systems: Building a Data-Driven Marketing Engine
Frequently Asked Questions
How can small businesses benefit from free BI tools?
Free BI tools give small businesses dashboard and reporting capability without upfront software cost, enabling data-driven decisions on a startup budget. Tools like Looker Studio connect directly to Google Sheets, databases, and ad platforms, so a small team can build operational reports in hours rather than commissioning a data analyst.
What factors should I consider when choosing a free BI tool?
Start with where your data lives: if it is in Google Ads or Google Sheets, Looker Studio is the lowest-friction option. If your team is already on Microsoft 365, Power BI Fabric Free integrates naturally, though sharing dashboards requires a paid license. If you have developer capacity and want direct database access, Metabase open source is self-hosted and free with no user cap.
Does Power BI have a genuinely free tier for teams?
Power BI Fabric Free lets individual users create and view their own reports at no cost, but it does not support sharing dashboards with colleagues or publishing to shared workspaces. Those collaboration features require a Power BI Pro or Premium Per User license, per Microsoft documentation.