Self-service BI is a business intelligence delivery model that gives analysts and business users direct access to data exploration and reporting without routing every query through a central data engineering team. The model has moved from analyst novelty to default expectation across mid-market analytics functions, and the operator question is no longer whether to allow it but where to draw the line between governed exploration and engineered, certified reporting. This article maps that line. It compares self-service business intelligence against the traditional analytics stack across five operational dimensions, sets out the conditions under which each model is the correct architectural choice, and describes the governed self-service pattern most teams settle into once the trade-offs surface. Readers who want the broader business case for analytics inside a revenue function should start at the Benefits Of CRM In Sales, Marketing, And Customer Service hub.
What Self-Service BI Actually Means
Self-service BI (SSBI) is a capability shift more than a tool category: the business analyst builds the report themselves in Tableau, Power BI, or Looker rather than filing a ticket with data engineering and waiting on a sprint slot. The defining characteristic is direct authorship. A regional sales lead segments pipeline by stage and rep without a JIRA queue. A marketing operations analyst breaks campaign performance down by channel and cohort in an afternoon. The supporting infrastructure (warehouse connections, certified datasets, semantic models) is still maintained centrally, but query construction, visualization, and iteration sit with the person who has the business question.
Self-service does not mean ungoverned. The SSBI spectrum runs from shadow IT analytics on one end (analysts pulling raw extracts into local spreadsheets with no access controls or lineage) to governed self-service on the other (a curated data catalog, row-level security configured at the warehouse, certified datasets endorsed by data owners, and a published metric glossary). Most production deployments of self-service business intelligence sit closer to the governed end because the ungoverned end produces credibility failures that are expensive to unwind. For a side-by-side look at the major SSBI platforms, see BI Platforms Compared: Tableau, Power BI, Looker, which goes deeper on vendor capability than the comparison axes covered here. Industry analyst framing for the governed self-service trend is summarized in the Gartner Magic Quadrant for Analytics and BI Platforms.
How Traditional Analytics Works
Traditional analytics keeps authorship inside a centralized data team. A data engineering function owns the extract-transform-load pipeline, the warehouse schema, and the semantic layer that translates physical tables into business concepts. Business users consume certified reports rather than build them. The canonical architecture is three tiers: source systems (CRM, ERP, product telemetry), the warehouse (Snowflake, Redshift, or BigQuery), and the BI presentation layer running on top of a curated semantic model. Change requests flow through a backlog, get prioritized, and reach production after engineering review.
The four roles in a traditional analytics governance model are worth defining precisely, because the boundaries between them are what the centralized data team enforces.
- Data engineer. Owns the warehouse, ingestion pipelines, and infrastructure reliability; enforces the source-of-truth boundary between raw and modeled data.
- Analytics engineer. Owns the transformation layer and semantic models in dbt or LookML; enforces the metric definition boundary so KPIs resolve consistently across reports.
- BI developer. Builds and certifies dashboards against the semantic layer; enforces the visualization and report-quality boundary before content reaches business consumers.
- Report consumer. Reads certified dashboards and files requests for changes; the consumer role does not author against raw data, which is the boundary the model exists to preserve.
This model trades velocity for consistency. The trade-off is real, not rhetorical, and it produces predictable failure modes when the workload outgrows the throughput of the central team. The structural failure patterns are cataloged in Common Challenges With Traditional Analytics.
Self-Service BI Versus Traditional Analytics Across Five Dimensions
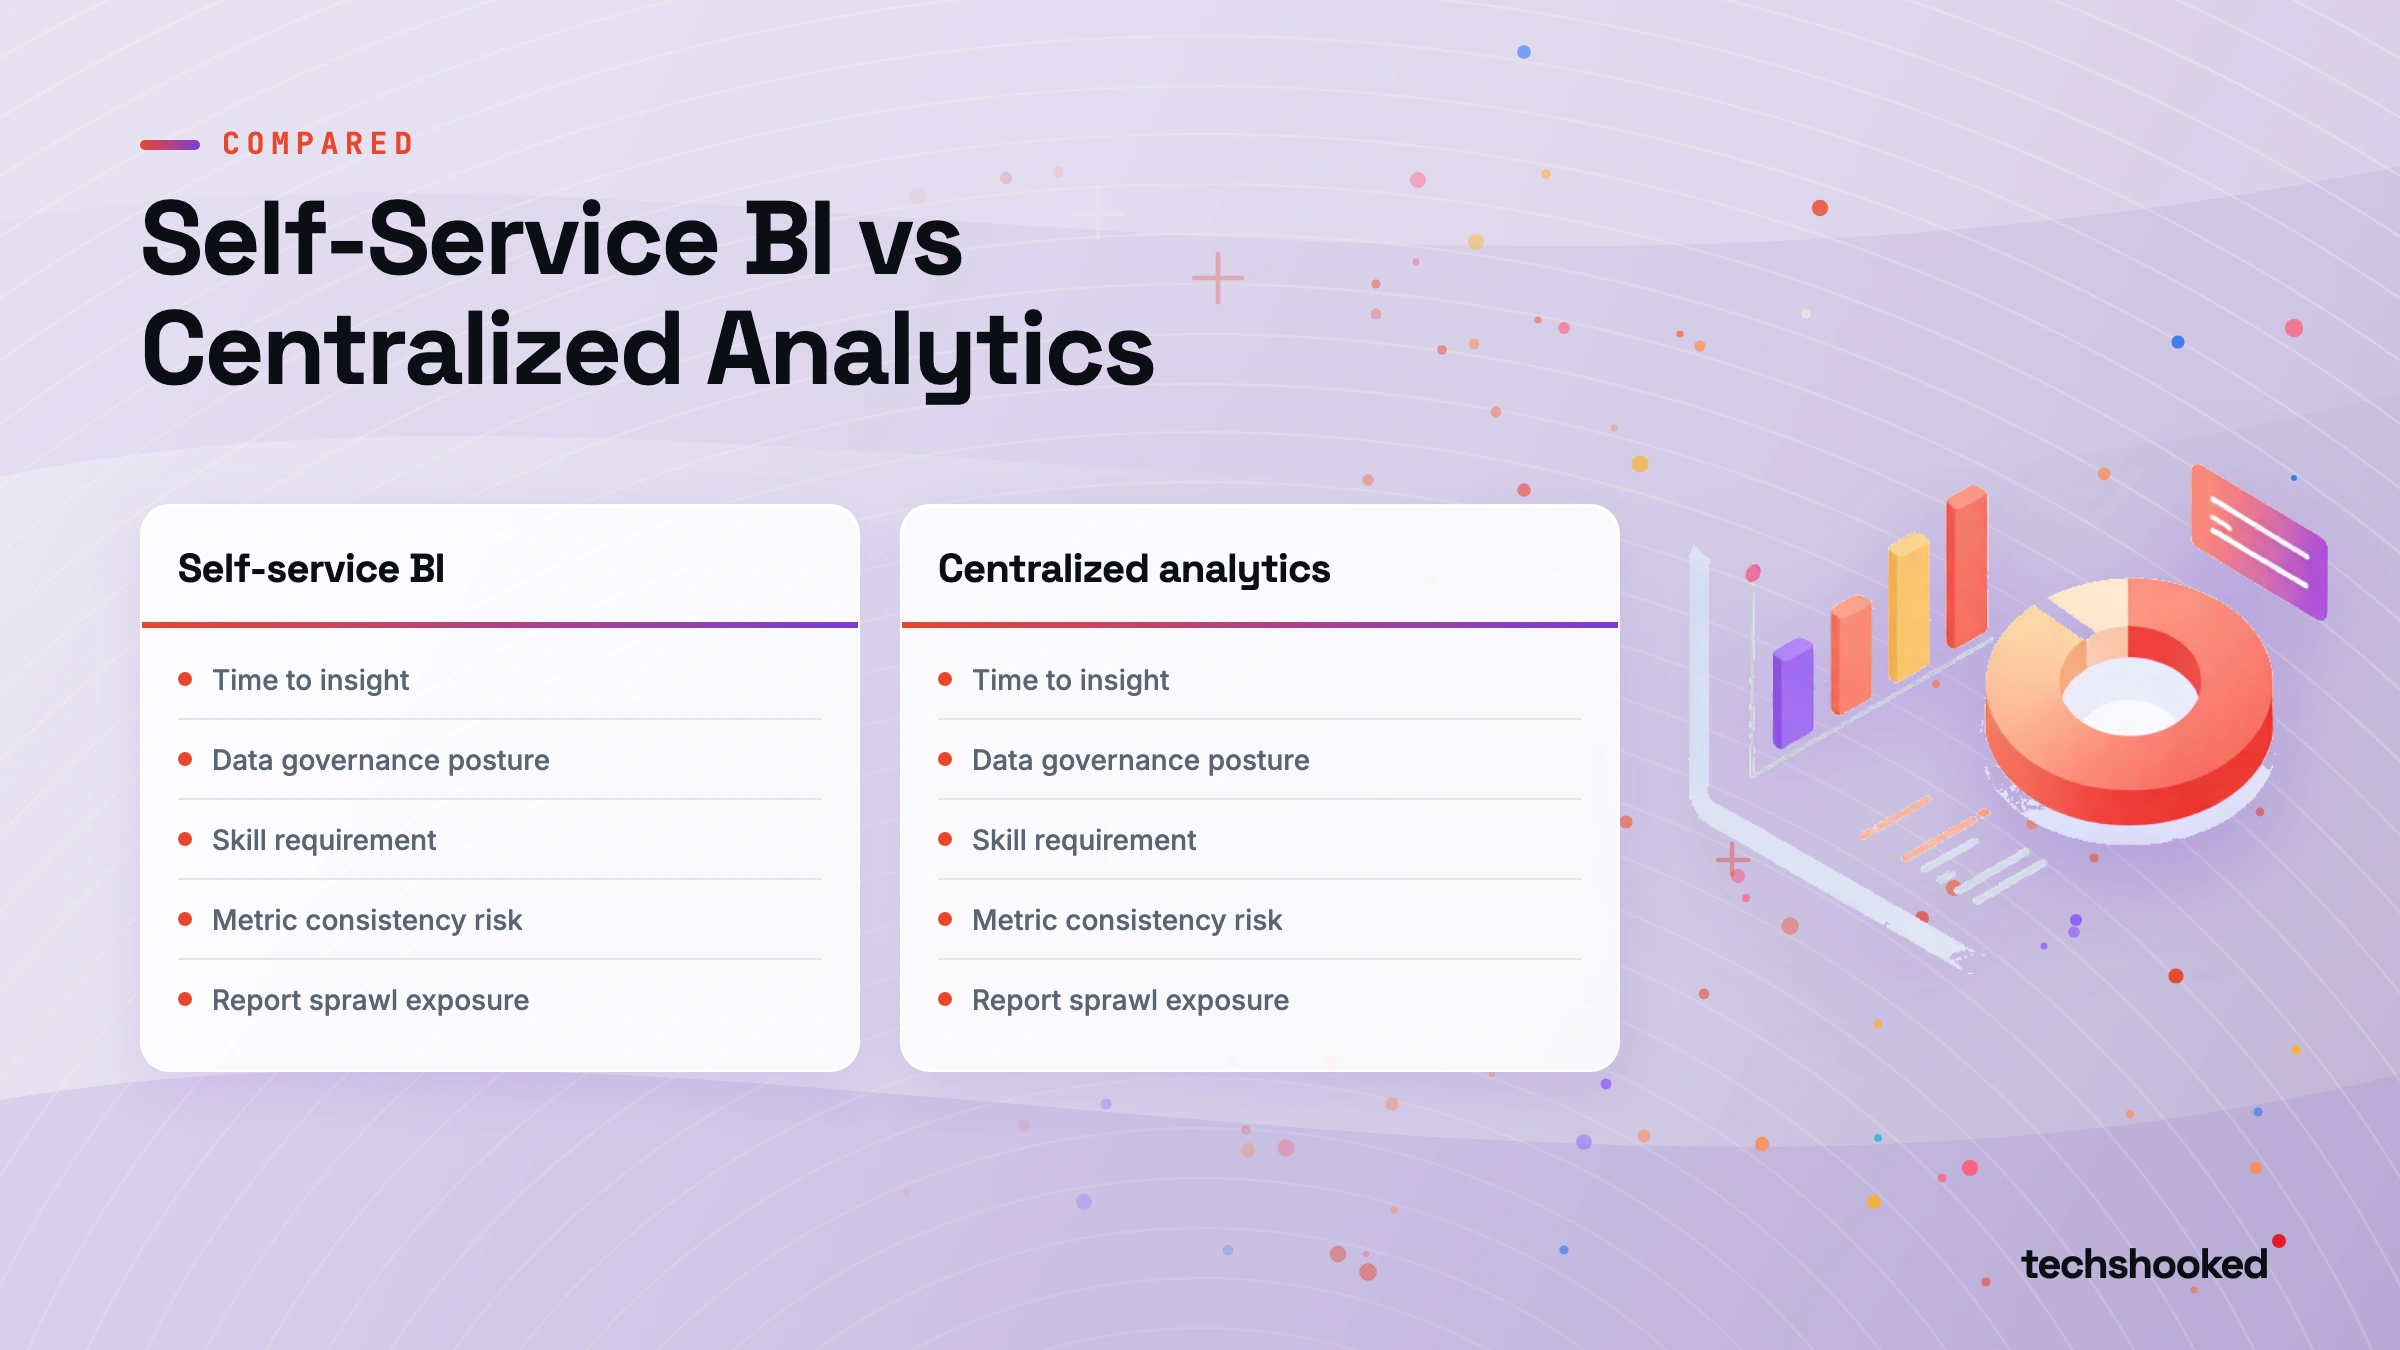
Self-service BI and classic analytics diverge most sharply on five operational dimensions: time to insight, data governance posture, skill prerequisites, metric consistency risk, and report sprawl exposure. The table below contrasts how each model behaves on each axis.
| Dimension | Self-Service BI | Centralized analytics |
|---|---|---|
| Time to insight | Ad hoc answers in hours, sometimes minutes | Engineered reports in days to weeks, depending on backlog |
| Data governance posture | User-defined filters and joins; governance enforced through catalog and certification | Centralized enforcement through the semantic layer and engineering review |
| Skill requirement | Data literacy plus tool fluency in Tableau, Power BI, or Looker | SQL, modeling discipline, and engineering review for production reports |
| Metric consistency risk | High exposure to metric definition drift when KPIs are computed locally | Low; a single semantic layer resolves KPIs the same way for every report |
| Report sprawl exposure | High without a certification and deprecation process | Low; engineering review naturally caps the report inventory |
The two cells worth dwelling on are metric definition drift and report sprawl. Both are the structural costs the self-service BI model takes on in exchange for velocity, and both are what the governed self-service pattern is engineered to contain. When two analysts compute revenue with slightly different filter logic against slightly different base tables, the resulting numbers stop reconciling, executive trust erodes, and the analytics function spends recovery cycles auditing definitions instead of producing new insight. Peer-reviewed treatment of the governance trade-off appears in IEEE research on data governance frameworks, which formalizes the lineage and certification controls that contain the drift.
When SSBI Is the Correct Choice
Self-service analytics is the correct architectural choice when the conditions below hold. Each item is a test an analytics lead can evaluate as true or false for their own environment; the model fits when most of them resolve to true.
- The organization has business analysts whose data literacy is sufficient to write correct filters, choose appropriate date grains, and interpret results without engineering validation.
- The analytics backlog consistently takes more than five business days to clear routine requests, indicating the centralized data team has become the bottleneck on decision velocity.
- The dominant use case is ad hoc analysis (campaign performance, pipeline inspection, churn segmentation, cohort drilldowns) rather than regulated financial or compliance reporting.
- A semantic layer and row-level security are in place or can be implemented before access is granted, so that data data data democratization runs against pre-governed surfaces rather than raw transactional tables.
- Team size and budget support the data catalog, certification program, and training investment that governed model requires to remain trustworthy past the first quarter.
- Decision velocity, not audit defensibility, is the primary constraint the analytics function is being asked to relieve.
If four or more conditions resolve to true, the operational case for SSBI is strong enough to justify the rollout. If fewer than three resolve to true, the rollout will surface the governance failure modes before it delivers the velocity gain.
When Centralized BI Remains the Right Model
Central analytics is not archaic; it is the correct model under a specific set of conditions where audited consistency outranks raw turnaround speed. The retention case typically holds when one or more of the following are true.
- The reporting workload is inherently low-velocity and regulated (quarterly board reporting, SOX financial close, GDPR Article 30 records of processing) where audited lineage from source to report is a compliance requirement, not a preference.
- Data literacy across the business user population is insufficient to produce reliable results without engineering validation, and the cost of incorrect reports exceeds the cost of slower delivery.
- Metric definitions are actively contested across teams (finance and product disagree on what active user means, sales and revenue ops disagree on bookings) and require centralized enforcement through the semantic model to prevent reporting credibility from collapsing.
- The analytics workload is purely retrospective with no requirement for intraday decision-making, removing the velocity argument that usually motivates the switch to SSBI.
- The centralized data team is right-sized to the workload, meaning backlog clearance times are stable rather than degrading quarter over quarter.
Enterprise environments running heavyweight Power BI or Tableau deployments at scale frequently fall into this category for their regulated reporting workloads while running SSBI in parallel for marketing and product analytics. The platform-specific trade-offs at that scale are covered in Enterprise Analytics: Power BI vs Tableau.
The Hybrid Path: Governed pattern
Self-service tooling and IT-led analytics are not mutually exclusive, and most mid-market teams settle on a hybrid model called governance pattern. A small analytics engineering team maintains a centralized data model layer and a catalog of certified datasets; qualified business analysts get self-service exploration rights against those pre-governed surfaces. The architecture is well-established: dbt handles transformation, a metrics layer such as MetricFlow or Cube enforces KPI definitions, and a data catalog (Atlan, Alation, or Collibra at enterprise scale) handles certification, lineage, and stewardship. The canonical reference implementation of centralized metric enforcement at the BI layer is described in the Google Cloud Looker documentation on self-service analytics, where LookML serves as the single definition surface that every downstream report resolves against.
Five implementation requirements separate governance model from the ungoverned variant that surfaces metric drift within two quarters.
- A certified dataset program where data owners endorse specific tables and views as the approved source for a given domain, and uncertified datasets carry visible warnings inside the BI tool.
- Row-level security configured at the warehouse layer, not the BI tool, so the access boundary holds regardless of which client connects to the data.
- A data literacy assessment that gates self-service access, ensuring every analyst with authoring rights has demonstrated working knowledge of joins, filter logic, and metric resolution.
- A metric governance process that routes KPI additions and changes through a defined owner, with the metric layer as the single source of truth for definitions.
- A report certification and deprecation workflow that promotes well-built reports, retires duplicates, and prevents report sprawl from accumulating into a maintenance liability.
The total cost of ownership (total cost of ownership (TCO)) calculation favors governed approach over the ungoverned alternative even though the upfront tooling and process investment is higher. Ungoverned SSBI looks cheaper for the first two quarters, then loads the analytics team with metric reconciliation work, dashboard auditing, and trust recovery that exceeds the savings. Analyst framing for the total cost of ownership argument and the controlled self-service trend appears in Forrester Research on Enterprise BI Platforms. Teams that also need streaming or near-realtime data into the same governed surface should review Realtime Analytics In CRM and Sales Platforms for the additional architectural requirements that intraday workloads impose.
Further reading
- Benefits Of CRM In Sales, Marketing, And Customer Service (hub)
- BI Platforms Compared: Tableau, Power BI, Looker
- Common Challenges With Standard analytics
- Enterprise Analytics: Power BI vs Tableau
- Asana vs Trello vs ClickUp: Project Management Software Compared
Self-service BI delivers data democratization at scale, putting analytical capability in the hands of every business unit; data democratization is the operational outcome that justifies SSBI investment.
Frequently Asked Questions
What happens to data governance when a company switches to self-service approach?
Switching to self-service capability without a governance layer transfers data quality risk from the data engineering team to individual business users, which routinely produces metric definition drift and dashboard sprawl within six to twelve months. Each analyst builds reports against raw or lightly transformed data using their own filter logic and date-range defaults, so the same metric (revenue, active users, churn rate) can return different numbers from different reports. Organizations that implement a gated self-service model before granting SSBI access contain this risk: a semantic framework enforces KPI definitions centrally, and a certified dataset program restricts ad hoc analysis to pre-validated data surfaces.
How do you measure whether the analytics backlog justifies moving to self-service workflow?
The most direct indicator is mean time from business question to delivered report: when that figure consistently exceeds five business days for routine ad hoc requests, the central team has become the primary bottleneck in decision velocity. A secondary indicator is the ratio of engineering hours spent on report maintenance versus net-new analysis: if more than 40 percent of data engineering capacity is consumed servicing existing dashboard change requests rather than building new analytical capability, the team is functioning as a report factory rather than an analytics function. Both metrics should be baselined before and after any rollout to confirm the bottleneck has shifted rather than simply moved. Smaller teams evaluating tooling first should review Alternatives To Looker For Small Businesses.
Can a small analytics team run self-service deployment without a dedicated data engineering function?
A small team can run a lightweight SSBI stack without a dedicated data engineering function if it scopes the data surfaces carefully: use a managed cloud warehouse (BigQuery, Redshift, or Snowflake on a starter tier), connect a BI tool with a built-in unified semantic model (Looker Studio or Power BI with certified datasets), and limit self-service access to pre-defined dimension tables rather than raw transactional tables. The constraint is that guarded self-service at this scale still requires at least one analytics engineer to maintain the transformation layer and certify datasets; without that role, metric definition drift and report proliferation emerge as the team and data volume grow. Teams planning to add forecasting on top of the same governed surface should see Predictive Analytics With BI Tools.