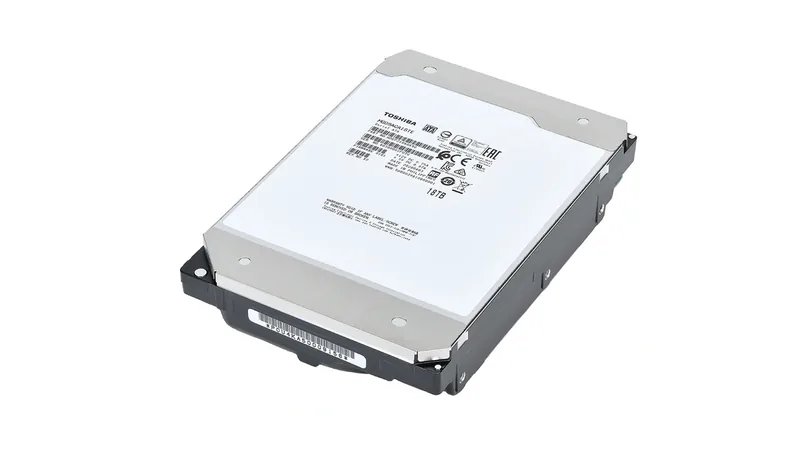
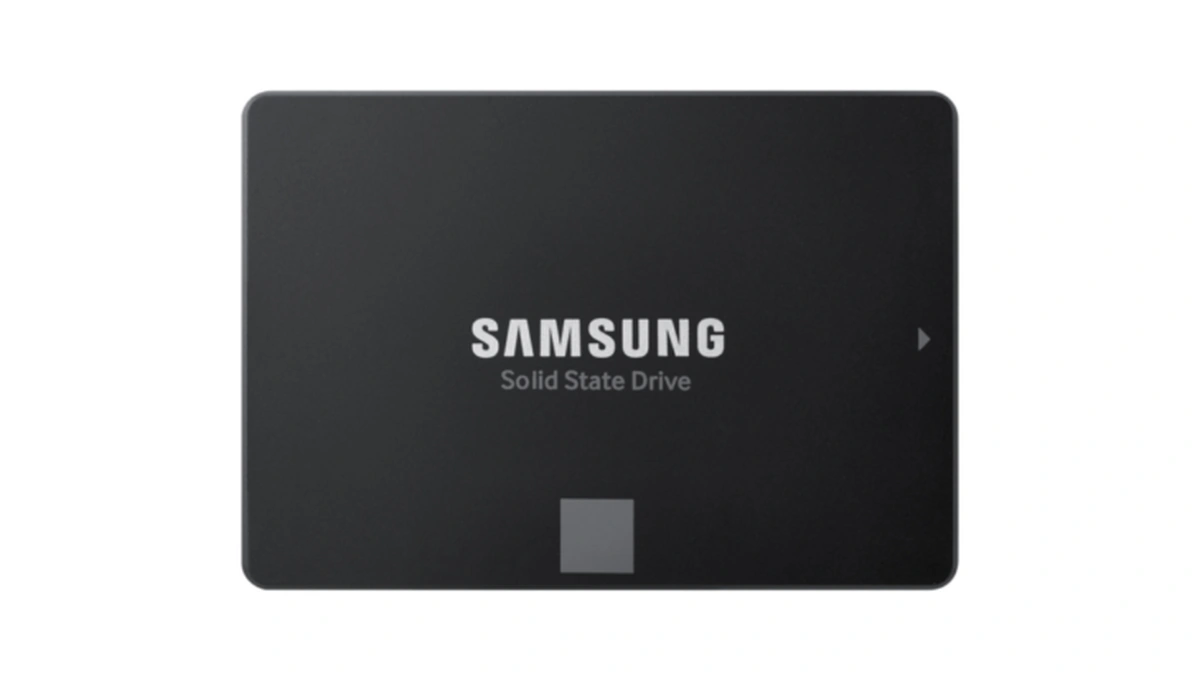
SSD is a storage device that replaces the mechanical hard drive and delivers the single largest measurable performance gain available to a PC upgrade cycle. Most performance complaints in aging PCs trace back to the storage layer, not the processor. Before spending money on a CPU or GPU, it is worth confirming that the storage, memory, and motherboard are each doing their share of work. This guide maps the measurable contribution of each component and ranks them by upgrade ROI for owners of an existing machine.
Understanding SSD vs HDD Performance
SSD access latency is measured in microseconds; a mechanical hard drive needs milliseconds to complete the same operation. That gap defines the SSD vs HDD divide more precisely than any marketing claim. A 7,200 RPM hard drive delivers roughly 150 MB/s sequential read throughput. A SATA SSD reaches around 550 MB/s. An NVMe sequential read from a PCIe Gen 4 drive clears 7,000 MB/s. The practical effect is not just faster file transfers; it is the elimination of a storage bottleneck that was throttling every operation the OS issued, from boot to application launch to file indexing.
DRAM cache plays a separate role that gets less attention. Drives with an onboard DRAM cache use it to store the drive's mapping table, the index that translates logical block addresses to physical NAND locations. Without a DRAM cache, the drive must fetch the mapping table from slower NAND flash on every random read. DRAMless NVMe drives perform acceptably in sequential workloads but show a marked write speed cliff once the small SLC (single-level cell) write cache saturates, typically after 10 to 30 GB of sustained writes. Write speed can fall from 3,000 MB/s to under 500 MB/s at that threshold.
When the processor and RAM are idle waiting on the storage layer, a faster CPU produces no measurable gain. Resolving the storage bottleneck first is the correct sequencing decision. See the component comparison guide for laptops, desktops, and workstations and the best gaming PC parts selection breakdown.
Key Differences Between SSDs and HDDs
SSD upgrades remove the storage bottleneck, but the next constraint becomes visible quickly in memory-intensive workloads: RAM capacity and channel configuration. At 8 GB, Windows will use the page file (a swap file on the SSD) as overflow memory. Every page-file access reroutes IO back to storage, partially negating the SSD upgrade's gains. At 16 GB, most games and productivity applications run resident in DRAM without paging. At 32 GB, video editing timelines, virtual machines, and browser-heavy development environments stay fully in memory.
DDR5 dual-channel configuration doubles effective memory bandwidth over a single-stick installation. Two matched sticks in the correct paired slots (typically slots A2 and B2 on most consumer boards) form a 128-bit wide memory bus versus the 64-bit bus a single stick creates. The JEDEC DDR5 standard specifies baseline speeds at 4,800 MT/s; enabling an XMP profile (Intel's eXtreme Memory Profile) or EXPO profile (AMD's equivalent) in BIOS pushes the sticks to their rated speed, often 6,000 to 6,400 MT/s for DDR5 kits. That activation step is manual and requires entering BIOS at startup, selecting the XMP profile entry, and saving.
CAS latency measures the number of clock cycles between a memory command and data delivery. Lower CAS latency at the same frequency is faster, but higher-frequency kits at higher CAS latency often win in practice because the absolute time per cycle shrinks as frequency rises. For gaming workloads, frequency gains matter more than CAS latency reduction. For latency-sensitive financial or audio applications, CL latency reduction at a fixed frequency is the better lever. The CPU vs GPU productivity and gaming guide covers how RAM interacts with processor selection. For platform-specific CPU choices, see the best CPU for productivity and gaming.
Choosing the Best RAM for Your Needs
Corsair Dominator Titanium, G.Skill Trident Z5, and Kingston Fury Beast are three DDR5 families with consistent XMP certification and Samsung B-die subcomponents in several SKUs. Samsung B-die is a recognized signal among overclockers because B-die NAND responds well to tight sub-timing adjustments beyond XMP defaults. JEDEC compliance matters more than brand preference for most buyers; a JEDEC-compliant kit will always run at its rated base speed, regardless of whether XMP activation succeeds. DDR4 remains cost-competitive for AM4 and LGA1700 platforms where DDR5 offers no motherboard support.
Five-step RAM upgrade decision checklist:
- Confirm current installed capacity and channel configuration via Task Manager (Performance tab, Memory).
- Count open DIMM slots; two empty slots favor a matching kit addition over replacement.
- Check the CPU's integrated memory controller (IMC) maximum supported speed in the processor specifications page.
- Enable the XMP profile in BIOS after seating the new sticks and verify the reported speed matches the kit's rated frequency.
- Confirm dual-channel bonding by checking that Task Manager shows the correct memory bandwidth at the expected speed.
Motherboards and Their Impact on Performance

SSD throughput, RAM frequency, and CPU clock speed all have a ceiling set by the motherboard. The board does not directly add performance; it determines how close each other component can get to its rated specification. Three mechanisms account for most of the constraint: VRM topology, PCIe lane allocation, and memory trace quality.
VRM topology refers to the voltage regulator module design, specifically the number of power phases delivering current to the CPU. A budget board with four phases distributes processor power delivery across fewer components than a mid-range board with twelve phases. Under sustained all-core workloads (video encoding, 3D rendering, compilation), inadequate VRM phase count causes thermal runaway in the VRM itself, triggering CPU throttling. The CPU reduces its operating frequency to stay within the power budget the VRM can sustain. The result is clock-speed reduction during exactly the tasks that most justify a fast processor.
PCIe lane allocation determines which M.2 slots carry full Gen 4 bandwidth and whether those slots share lanes with the GPU. On B-series chipsets (B760 for Intel, B650 for AMD), the primary M.2 slot may share PCIe lanes with the x16 GPU slot through bifurcation logic. Installing a high-speed NVMe drive in a slot running at x2 or x4 via a shared lane allocation limits actual throughput to a fraction of rated read and write speed. The board manual's block diagram identifies whether each M.2 slot runs from the CPU directly (full-speed) or from the chipset (potentially Gen 3). Sources on NVMe architecture and storage interface standards are available at the IEEE Xplore NVMe performance analysis and the NIST SP 800-88 Rev 1 storage device guidelines.
For comparison with sibling performance articles, see Apple Silicon vs Intel vs AMD and the AMD Ryzen vs Apple M Series breakdown.
Selecting the Right Motherboard
Socket compatibility is fixed by the CPU: AM5 for AMD Ryzen 7000 and 9000 series, LGA1700 for Intel 12th through 14th Gen, LGA1851 for Intel Core Ultra 200. Chipset tier governs overclocking access and PCIe lane budget. Z-series (Z790, Z690) and X-series (X670E) unlock CPU multiplier overclocking and expose more PCIe lanes to the user. B-series boards apply the same CPUs at lower cost by restricting lane count and memory overclocking flexibility. The board's QVL (Qualified Vendor List) lists RAM kits tested for compatibility by the manufacturer; consulting it before purchasing a RAM kit reduces the risk of XMP profile instability at high frequencies.
| Tier | Example Chipsets | VRM Phases (typical) | M.2 Slots (PCIe Gen) | Max Validated Memory Frequency |
|---|---|---|---|---|
| Budget | B760 / B650 | 4-8 | 2 (Gen 4 + Gen 3) | DDR5-6000 |
| Mid-range | Z790 / X670E | 10-16 | 4-5 (Gen 4 or Gen 5) | DDR5-7200+ |
| High-end | X299 / TRX50 | 16-24 | 6+ (Gen 4/Gen 5) | DDR5-8000+ |
Upgrade Sequence: Which Component to Prioritize
SSD replacement delivers the largest single-component gain per dollar for any PC built before 2020 that still runs an HDD or SATA SSD. No other upgrade compresses as much latency out of daily use for as low a cost. The argument for sequencing is straightforward: a storage bottleneck keeps the CPU and RAM underutilized. Removing it first reveals whether those components are already sufficient for the target workload, potentially eliminating the need for further spending.
Measured boot time from an HDD baseline to a Gen 4 NVMe drive typically drops by 20 to 40 seconds. Application launch times compress from several seconds to under one second in most cases. Read and write speed improvements are visible in every file transfer, compilation, or database query that previously waited on rotational seek. A RAM upgrade from 8 GB to 16 GB reduces average frame time stutter in memory-constrained game titles by 30 to 50 ms, according to hardware benchmark data. A motherboard swap in isolation, with no change to CPU, RAM, or storage, produces no measurable FPS delta in gaming workloads. The workstation video editing guide covers RAM and storage scaling for professional creative workloads.
Ranked upgrade paths with cost ranges:
- NVMe PCIe Gen 4 SSD (first priority): $60-$120 for 1 TB. Eliminates storage bottleneck. Applies to any system still on HDD or SATA SSD. Boot time and application launch gains are immediate and universal. No other component change is required.
- RAM upgrade to 16 GB or 32 GB DDR5 dual-channel (second priority): $80-$180 for 2x16 GB DDR5. Applicable when the system has 8 GB or less, or when a single stick is installed. Enable XMP setting after installation. Memory bandwidth gains benefit gaming, compilation, and virtualization workloads.
- Motherboard replacement (third priority, platform upgrade only): $150-$400. Justified when the CPU socket is changing, VRM throttling is confirmed under sustained load via hardware monitoring tools, or additional high-speed M.2 slots are required. Standalone board replacement for gaming FPS is not supported by benchmark evidence.
How to Test SSD Speed on Windows
SSD benchmarking on Windows starts with CrystalDiskMark 8.0, the reference tool for measuring read and write speed across drive interfaces. Run the default five-pass test at 1 GB file size to generate sequential and 4K random results at both queue depth 1 and queue depth 32. The queue depth 1 sequential read result is the figure most representative of OS and application responsiveness, because the OS issues most IO serially during normal use. NVMe sequential read at queue depth 32 reflects peak controller throughput and matches the numbers reported in manufacturer specifications.
A healthy Gen 4 NVMe drive should show sequential read above 6,000 MB/s and 4K QD1 read above 60 MB/s. A 4K QD1 read below 30 MB/s on an SSD indicates either a DRAMless drive without an onboard DRAM cache or a PCIe lane speed mismatch where the drive is running at Gen 3 speeds in a Gen 4 slot due to incorrect slot assignment. AS SSD Benchmark provides a secondary cross-check and reports a compatibility score that flags lane-speed mismatches explicitly. The storage bottleneck in a DRAMless drive becomes visible when write speed drops sharply after 10 to 20 GB of sustained sequential writes, collapsing from 3,000 MB/s to below 500 MB/s as the SLC cache saturates and the drive writes directly to TLC or QLC NAND at base speed. See the developer laptop comparison for storage performance benchmarks in portable form factors.
- CrystalDiskMark 8.0: Sequential QD32, Sequential QD1, 4K QD32, 4K QD1. Measures peak throughput and OS-representative random access. Pass threshold for a Gen 4 NVMe: sequential read >6,000 MB/s, 4K QD1 read >60 MB/s.
- AS SSD Benchmark: Secondary tool with lane-speed compatibility scoring. Flags Gen 3 vs Gen 4 mismatches. Use to confirm a CrystalDiskMark anomaly.
- Windows Storage Spaces diagnostic: Relevant for RAID or mirrored configurations; reports array health, rebuild status, and per-drive read and write speed independently.
- Task Manager (Performance > Disk): Real-time read and write speed during active workloads. Useful for identifying which application is generating storage IO and whether the drive is saturating.
Further reading
Frequently Asked Questions
Do motherboards affect gaming FPS?
Motherboards do not directly increase gaming FPS, but they can constrain it through VRM topology limitations and PCIe lane allocation restrictions. A board with inadequate VRM phase count throttles a high-TDP CPU under sustained all-core load, reducing clock speeds and cutting frame rates in CPU-bound titles. A board that shares PCIe bandwidth between the primary M.2 slot and the x16 GPU slot reduces NVMe throughput when both are populated, adding latency to shader loading and asset streaming during level transitions.
What are common SSD performance issues?
The most common SSD performance problems are DRAM cache exhaustion on DRAMless drives, incorrect PCIe slot assignment, and firmware-level SLC cache depletion. DRAMless NVMe drives perform acceptably in sequential reads but drop to HDD-comparable write speeds once the SLC write cache fills, typically after sustained writes of 10 to 30 GB. Installing an NVMe SSD in an M.2 slot running at PCIe Gen 3 speeds instead of Gen 4 halves peak throughput; verify the slot specification in the motherboard manual before seating the drive. The JEDEC DDR5 specification at JEDEC JESD79-5B Cloud-platform memory-bandwidth references are documented in the AWS EC2 instance memory specs. provides authoritative DDR5 parameter baselines for cross-checking memory configuration claims. See also: smartwatch.
How can I test SSD speed on Windows?
CrystalDiskMark 8.0 is the standard tool for testing SSD read/write speed on Windows. Run the default five-pass test at 1 GB file size to get sequential and 4K random throughput speed results. For a healthy Gen 4 NVMe drive, expect sequential read above 6,000 MB/s and 4K QD1 read above 60 MB/s. A 4K QD1 read below 30 MB/s on an SSD indicates either a DRAMless drive or a PCIe lane speed mismatch. The hub article on iOS vs Android covers mobile storage performance in a separate context.